Soybean Disease Considerations As the 2019 Harvest Approaches

Damon L. Smith, Associate Professor and Extension Field Crops Pathology Specialist, University of Wisconsin-Madison

Shawn P. Conley, Professor and Extension Soybean and Small Grains Agronomy Specialist, University of Wisconsin-Madison 

As the days get shorter and the temperatures start to cool, soybean harvest is on everyone’s minds. As the crop is maturing and beginning the early stages of drydown, calls about diseases are starting to come in. In the southern third of the state most of the calls have centered on sudden death syndrome or SDS. To the north, most questions pertain to Sclerotinia stem rot or white mold. Below we will discuss SDS in some detail and provide a brief update on the white mold situation as well as elaborate on seed decay issues that we should pay attention to as we begin harvest.

Scout for Sudden Death Syndrome (SDS)

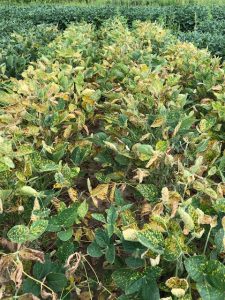
Figure 1. Symptoms of sudden death syndrome on soybeans

The first noticeable symptoms of SDS (Fig. 1) are chlorotic (i.e., yellow) blotches that form between the veins of soybean leaflets. These blotches expand into large, irregular, chlorotic patches (also between the veins), and this chlorotic tissue later dies and turns brown. Soon thereafter entire leaflets will die and shrivel. In severe cases, leaflets will drop off leaving the petioles attached. Taproots and below-ground portions of the stems of plants suffering from SDS, when split open, will exhibit a slightly tan to light brown discoloration of the vascular (i.e., water- conducting) tissue. The pith will remain white or cream-colored. In plants with advanced foliar symptoms of SDS, small, light blue patches will form on taproots and stems below the soil line. These patches are spore masses of the fungus that causes the disease.

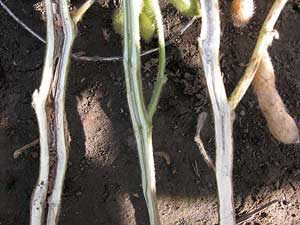
Figure 2. Symptoms of BSR in soybean stems compared with a healthy soybean stem in the center.

Foliar symptoms of SDS can be confused with those of brown stem rot. However, in the case of brown stem rot (BSR), the pith of affected soybean plants will be brown (Fig. 2). In addition, roots and lower stems of plants suffering from BSR will not have light blue spore masses.

Once symptoms of SDS are evident, yield losses are inevitable. Yield losses can range from slight to 100%, depending on the soybean variety being grown, the plant growth stage at the time of infection and whether or not SCN is present in a field. If SDS occurs after reproductive stages (R5 or R6) impact on yield is usually less compared to the development of SDS at flowering, which can lead to substantial yield losses. When SCN is present, the combined damage from both diseases can be substantially more than the sum of the damage expected from the individual diseases.

SDS is caused by the soilborne fungus, Fusarium virguliforme (synonym: F. solani f. sp. glycines). F. virguliforme can overwinter freely in the soil, in crop residue, and in the cysts of SCN. The fungus infects soybean roots (by some reports as early as one week after crop emergence), and is generally restricted to roots as well as stems near the soil line. F. virguliforme does not invade leaves, flowers, pods or seeds, but does produce toxins in the roots that move to the leaves, causing SDS’s characteristic foliar symptoms.

SDS cannot be controlled once plants have been infected. Foliar fungicides have NO effect on the disease. Recently a new seed treatment has been identified that has efficacy against SDS. The active ingredient fluopyram can be found in the seed treatment iLeVo and is rated “very good” in multi-state trials. Other methods of control include using SDS-resistant varieties whenever possible in fields with a history of the disease; however, keep in mind that SDS-resistant varieties with maturity groups suitable for Wisconsin and other northern regions (groups I and II) can be limited. If SDS and SCN are both problems in the same field, planting an SCN-resistant soybean variety may also be beneficial in managing SDS. Do not delay planting soybeans to avoid symptoms of SDS.  In Wisconsin, it has been demonstrated that the benefits to yield when planting early outweigh the benefits of reduced SDS symptoms if planting is delayed. Improve soil drainage by using tillage practices that reduce compaction problems. Rotation, while useful in managing other soybean diseases, does not appear to significantly reduce the severity of SDS. Even after several years of continuous production of corn, F. virguliforme populations typically are not reduced substantially. Research from Iowa State University has shown that corn (especially corn kernels) can harbor the SDS pathogen.

For more information CLICK HERE to download a full color fact sheet on SDS. A short video on SDS can also be viewed by CLICKING HERE.

Know Where White Mold is in 2019

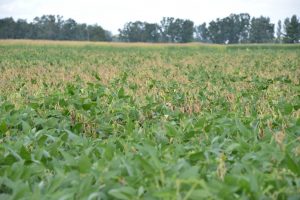
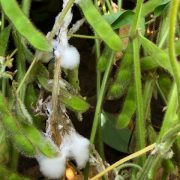
Figure 3. White Mold in a Soybean Field

Symptoms of white mold (Fig. 3) are becoming pretty apparent in some parts of central and northern Wisconsin. White fluffy growth (mycelium) is readily evident over the last week while weather has been humid and wet. Incidence in the northern half of the state is high in some fields. Fields in the northeast and northwest corridors of the state seem to be hardest hit, but severity is highly variable from one field to the next.  This is likely due to a combination of variety and micro-environments that can influence the disease. Most of the soybean crop is at the R6 growth stage, with some earlier maturing fields are almost through R7 or have made it to R8. Now the question is how much soybean yield might I lose from white mold?

Research has demonstrated that for every 10% increase in the number of plants that are infected with white mold at the R7 growth stage, you can expect between 2 to 5 bushels of yield loss. Thus, fields with low levels (say 3% incidence) will likely experience no detectable yield loss while fields with 20% incidence could lose as much as 10 bushels per acre.

What should I do if I see white mold in my soybean field now?

The first step is to get out and survey your fields for white mold. It is a good idea to determine how much white mold you have in your fields, so you can make some educated harvest decisions. One way to move white mold from one field to the next is via combines. You could clean your combine between each field, but this can be time consuming. So by determining which fields have no white mold and which fields have the most white mold, you can develop a logical harvest order by beginning your harvest on fields with no white mold and working your way to the heavily infested fields. This will help reduce spread of the white mold fungus to fields that aren’t infested. You can also make some decisions on your rotation plan and future soybean variety choices based on these late season observations.

If you would like to learn more about white mold and management of this disease, CLICK HERE to download a fact sheet from the crop protection network. You can also watch a short video about white mold by CLICKING HERE.

Watch for Phomopsis Seed Decay at Harvest

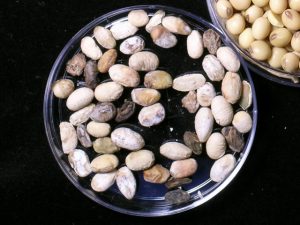
Figure 4. Severe Phomopsis seed decay. Photo Credit: Craig Grau, University of Wisconsin-Madison.

If you remember the 2018 harvest season, you are probably having nightmares right now. Extended rainy periods in October significantly delayed harvest and subjected the standing soybean crop to significant seed decay issues. Watch out for rainy periods during the 2019 harvest. If we end up in these wet patterns again in 2019, we could have a repeat of poor seed quality going into 2020. 

What does Phomopsis seed decay look like?

The fungus that causes Phomopsis seed decay (Fig. 4) can infect soybean plants early in the season and colonize pods and infect seeds near, or at maturity. Infected seed will often be shriveled or undersized and can have a white or chalky appearance. If pods are opened in the field a white cottony “mold” (different than that of white mold) can be observed. Infected seed can pass the Phomopsis seed decay fungus on in seedlings of the next soybean crop. Therefore, it is important to identify Phomopsis seed decay especially in soybean-seed fields.

What conditions are favorable for Phomopsis seed decay?

Warm and wet weather during pod fill and maturity favor the development of Phompsis seed decay. The conditions have been prevalent in areas of Wisconsin in 2019, especially where planting was delayed. Soybean varieties that mature early are also more prone to Phompsis seed decay. Other stresses such as nutrient deficiencies or virus infections can also increase the occurrence of Phompsis seed decay. Infested seed is a likely source of Phompsis seed decay, however, the fungus can survive on soybean debris and certain weeds like velvetleaf.

How should I handle soybeans with Phomopsis seed decay?

Scout fields before harvest to get an idea of how much Phomopsis seed decay you might have in a field. Scout multiple plants in at least 5 locations in a field, opening pods to determine if Phomopsis seed decay is present. In fields where Phomopsis seed decay is observed, harvest should be prioritized as soon as combines can enter the field. Seed infected with the Phomopsis seed decay fungus will continue to rot in the pod until they are harvested.

How should I manage Phomopsis seed decay in the 2020 soybean crop?

Soybean seed producers should try to clean seed to achieve less than 20% damaged seed in a seed lot. Multiple cleaning steps might be needed to achieve this level. While testing germination now is recommended, remember that testing germination again next spring and potentially just prior to delivery will also help you to understand the germination rate and determine if other management strategies need to be employed such as fungicidal seed treatments.

Seed treatments can help improve the germination rate of seed damaged by Diaporthe. However, you will need more than metalaxyl or mefonoxam active ingredients in your seed treatment. Metalaxyl and mefonoxam are good against Phytophthora and Pythium, but not effective against other organisms, like Diaporthe. Seed treatments with Phomopsis on the label have an additional fungicide (either a DMI or SDHI). Table 3-8 of the publication A3646 – Pest Management in Wisconsin Field Crops has a table of some of the seed treatments with Phomopsis on the label. Also available, as stated above, is the seed treatment efficacy table from the Crop Protection Network (CPN). You can download that publication by clicking here.

As farmers begin to look forward to the 2020 growing season we also recommend that you double check the percent germination on every seed lot prior to planting and adjust your seeding rates accordingly. Here are our recommendations for soybean seeding rate based on yield potential and white mold risk: The Soybean Seeding Rate Conundrum.

An Additional Phomopsis Seed Decay Resource

A fact sheet about Pod and Stem blight and Phomopsis seed decay has been developed by a consortium of soybean extension pathologists. You can download that fact sheet by clicking here.

Corn Disease and Nutritive Value Considerations for the 2019 Silage Harvest

Damon L. Smith, Associate Professor and Extension Field Crops Pathology Specialist, University of Wisconsin-Madison

John Goeser, Adjunct Assistant Professor, Department of Dairy Science, University of Wisconsin-Madison and Animal Nutrition Director, Rock River Laboratory, Inc

The 2019 silage corn harvest is finally starting to ramp up in Wisconsin. With the excitement of finally getting into the field comes the need to be aware of the corn disease situation this season. As most of you will remember, the 2018 field season was an extreme challenge when it came to making quality corn silage in Wisconsin. Foliar diseases of corn, forced the plants to lose photosynthetic capability pre-maturely, resulting in cannibalization of stalks for carbohydrates to fill ears. Loss in stalk integrity meant extreme lodging, not to mention that is was a struggle to find optimum moisture in any field. Throw in frequent rains, and trying to chop on time to achieve quality fermentation was nearly impossible in 2018. The consequences of the challenging season are still being felt with poor quality, wild yeast issues, and higher than typical mycotoxin loads. So what does 2019 look like?

Foliar Disease of Silage Corn in 2019 

Compared to 2018, the foliar disease situation has been less significant in 2019. However, there are still some important diseases to consider as you prepare for harvest. Statewide, gray leaf spot did appear early again this season. However, unseasonably cool weather kept this disease relegated to the lower canopy. For most fields we have visited, gray leaf spot will likely be of little impact on yield and feed quality this year. 

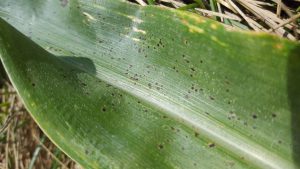
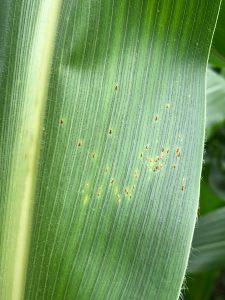
Figure 1. Tar spot on a leaf of corn located in Arlington, WI on August 7, 2019. Photo Credit: Hannah Reed, University of Wisconsin-Madison.

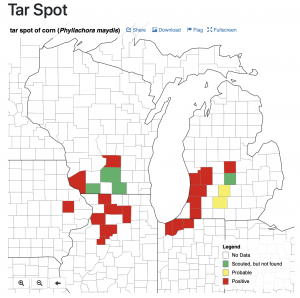
The flipside of the cooler weather meant that tar spot (Fig. 1) has become an issue again this year. Tar spot is favored by persistent temperatures between 60 and 70 F and high relative humidity averaging above 75% for a 30-day period. Periods of extended leaf wetness further facilitate increase and spread. We have been right in the ideal growth zone for the pathogen that causes tar spot since the first part of August. Over the last month, tar spot has been found in many areas of the state (CLICK HERE to view the latest national map for tar spot confirmations), leading to the 4th straight field season where this disease has impacted silage corn. While the disease has moved in later this season, compared to 2018, it is moving quickly. Tar spot can kill leaves prematurely, or reduce photosynthetic capacity. 


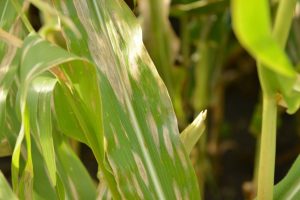
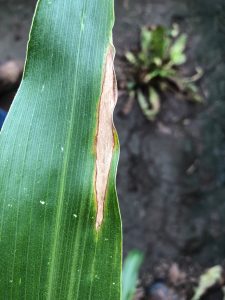
Figure 2. Northern corn leaf blight on corn.

Northern corn leaf blight (NCLB; Fig. 2) can also be readily found in the upper canopy in some fields in 2019. This disease has historically been a more significant problem on silage hybrids, increasing when the weather is cool and the humidity high. Depending on the severity and interaction of both NCLB and tar spot, these diseases can influence whole plant moisture levels and also cause stalk-cannibalization, leading to increased risk for lodging. As you prepare to chop silage, scout fields to understand the severity of foliar disease levels along with whole plant moisture and kernel maturity. Fields with the highest levels of foliar disease should be closely monitored for whole plant moisture and prioritized for harvest first. Then work your way to those fields with less visible disease.       

Ear rots and mycotoxins of silage corn in 2019 

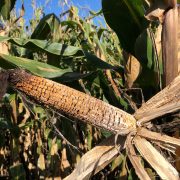
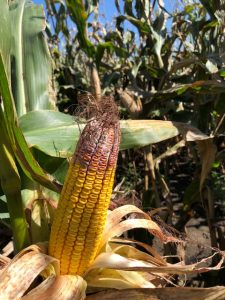
Figure 3. Gibberella ear rot on corn.

In 2018, corn production in Wisconsin was also plagued by high levels of Gibberella ear rot (Fig. 3) and high levels of deoxynivalenol (DON or vomitoxin) in finished grain and silage. Remember that vomitoxin is a secondary metabolite produced by the fungus that causes Gibberella ear rot. We believe that 2019 will be another year with high levels of Gibberella ear rot and vomitoxin levels. Weather has been wet, especially during silking on late-planted fields in 2019. This increases the risk of Gibberella ear rot. Furthermore, the fungus that causes Gibberella ear rot can cause Fusarium head blight (FHB or scab) in wheat. Vomitoxin can also accumulate in wheat grain resulting in unusable grain, or grain subjected to dockage at the elevator. The 2019 wheat season saw high levels of FHB in winter wheat, with subsequent reports of high levels of vomitoxin. Anecdotal reports of very high DON levels have been reported in wheat straw harvested in 2019. This situation further substantiates the possibility that corn might also be hit hard with Gibberella this year. When scouting fields, pull back some husks to see if there is visible ear rot. Note these fields where high levels of severity exist. Also, check fields for lodging and assess stalk integrity. The fungus that causes Gibberella ear rot can also cause Gibberella stalk rot. We also know that from some preliminary research, vomitoxin can accumulate in the stalk portions of the plant in addition to the ears. Fields with high levels of ear rot and/or stalk rot should be prioritized for harvest first. You might also consider keeping silage from these higher-severity fields separate from other fields you harvest. Also consider testing for nutritive quality and mycotoxin load as you chop silage, so you know how much vomitoxin is present and potentially from which fields. Information on testing grain and silage can be found by clicking here. An additional list of testing labs can be found in A3646-Pest Management in Wisconsin Field Crops in table 2-16. Remember that mycotoxins like vomitoxin are very stable. They cannot be removed by heating or freezing. When storing corn grain for long periods of time, we recommend drying grain down to 13%. This will help stop the continued growth of the fungus that can cause vomitoxin and reduce any subsequent accumulation of the mycotoxin. In silage corn production, harvesting at optimum moisture and packing the bunker and inducing fermentation and anaerobic conditions as quickly as possible will limit any further growth of the fungus and any additional accumulation of vomitoxin.
If you sprayed silage corn with fungicide in 2019, this might help reduce the levels of foliar disease, ear rot, and vomitoxin levels. However, it will not “cure” the situation nor is it anywhere near perfect. Research in 2018 demonstrated that fungicides could reduce disease levels, but in a year when weather conditions were conducive for ear rot and vomitoxin accumulation expectations needed to be lowered. In 2018 certain fungicide programs had the capability of reducing vomitoxin levels by 50% or more, but that still meant that a lot of the silage made was still considered unacceptable for feeding due to high vomitoxin levels. Remember that hybrid choice, in addition to treating with fungicide, can play an important role in how much vomitoxin is present and the nutritive value of the finished feed.

What are the impacts of poor silage quality and mycotoxin accumulation? 

Animal nutritionists have observed many impacts of mycotoxin and microbial growth challenges in animals, including dairy cattle. Performance and health issues can range from milk fat or milk protein percentage decreases, to decreased milk production and all the way on up to feed refusal, intestinal or gut hemorrhaging, and death. For this reason, nutritionists have devised guidelines for dietary limits of some mycotoxins to reduce harm to the animal. Dr. John Goeser has assembled the “Mycotoxin Guidelines and Dietary Limits” fact sheet to help producers better understand the potentially harmful toxin levels in the total diet (DM). You will see in that chart that for vomitoxin (DON), the suggested total mixed ration (TMR) concern limit is just 0.5 to 1.0 ppm for dairy cattle. The fact sheet also provides a helpful formula to understand the contribution of toxin in a particular component of feed, relative to the total diet.

Also recognize microbial growth (mold, yeast and negative bacteria) challenges will increase with wetter conditions. Both mycotoxin load and microbial contamination need to be checked if performance or health appear challenged for your herd. Start by checking the TMR and then work backward from there with your advisory team.

We are expecting a prolonged harvest this year due to unprecedented planting growing conditions earlier this season. As discussed previously, step up your crop scouting efforts to optimize harvest this year. Consider using the approach discussed in this recent Hoard’s Dairyman HD Intel newsletter to be proactive and stay in control this harvest.

The Take-Home

  1. Spend some time scouting fields for foliar, ear, and stalk disease. Prioritize harvest for fields with high disease severity.
  2. Be proactive. Consider testing corn silage for mycotoxins, specifically vomitoxin, a couple times as your farm begins harvest. If results come back greater than expected, consider increasing frequency so you know what you are dealing with before silage is ensiled.
  3. Consider keeping fields with high disease levels and/or high vomitoxin levels segregated from better feed. 
  4. Take time to target optimum harvest moisture and packing conditions to shorten time to anaerobic conditions and fermentation.
  5. Keep oxygen out of the silo. After the silo, bunker, pile, or bag have been sealed, continue watching for holes or leaks on a regular basis and repair damaged plastic or seams. 

Should I Be Applying Fungicide to My Fall Forage Oat Crop?

Damon Smith, Extension Field Crops Pathologist, Department of Plant Pathology, University of Wisconsin-Madison

Shawn Conley, Extension Soybean and Small Grains Agronomist, Department of Agronomy, University of Wisconsin-Madison

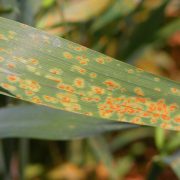
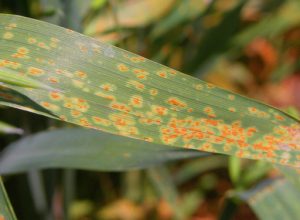
Figure 1. Crown rust on an oat leaf. Photo Credit: Craig Grau, University of Wisconsin-Madison.

Record prevent-plant acres and lack of on-farm forage has pushed WI farmers into trying alternative cropping systems in 2019. A record number of late planted oats have been planted with the intension of being used as a forage. Oats, planted the first week of August can be expected to produce 2.5 to 3 t DM/a in an average year.  Coblentz, USDA Dairy Forage Research Center, found that a late-maturing forage cultivar (ForagePlus) produced maximum annual yields ranging from 2 to 3.5 t DM/a.  Because the forage cultivar matured slowly it was better able to respond to sometimes erratic late-summer precipitation. These oat types mature later and produce more tonnage of quality forage.  In addition, fall planted oat is higher in forage quality than spring planted oats.  Research at the University of Wisconsin by Albrecht found that maturation of summer-sown (August) oats was delayed, resulting in 10 to 15% less neutral detergent fiber (NDF), 18% greater digestibility, and 250% more water soluble carbohydrate than spring-sown oat. With all of the cool wet weather in 2019 and lush plant tissue, these oats are likely to be challenged with crown rust. The question being posed today is should farmers be spraying these fall forage oats with a fungicide?

We are being up front here…we don’t have any empirical data to speak from so this our best educated GEUSTIMATE. The oat crown rust pathogen (Puccinia coronataf. sp. avenae) can quickly overcome genetic resistance in oat grain varieties. That means that certain varieties have better partial resistance than others, which can result in differences in yield and quality parameters in years when crown rust is significant. Examples of these differences can be found below:

It is important to know the level of resistance to crown rust that your variety has. This might dictate how often you scout in order to make your fungicide spray decision.

When it comes to fungicide efficacy, many products are very effective against oat crown rust. Haugen et al. at North Dakota State University conducted fungicide evaluations on oat for grain in 2014-2016. In all years fungicide was applied at flag leaf emergence. Products used included Headline®, Priaxor®, Tilt®, and Quadris®. In the 2015 and 2016 data, normalized difference vegetation index (NDVI) was recorded to measure quality of the vegetative portions of the plant. In all cases fungicide improved the NDVI scores relative to the control. Not surprisingly, a corresponding increase in yield was observed relative to the higher NDVI scores in the fungicide-treated oats. While these data are from oats for grain, it highlights the fact that fungicide can indeed protect oat plants from crown rust and delay disease development, resulting in greener, healthier vegetative plant parts.

When making the decision to apply fungicide on oats for forage, it appears that there are several products which are effective for controlling crown rust. Given the current farm economy, it might be good to find a product that is cheap, yet effective, to keep the cost of this input low. Several of the strobilurin only fungicides are labeled for control of rust in oats for forage. These include Headline® and Quadris®. Others might be available, however, read the labels very carefully. Be sure that oats for forage or hay is indicated on the label. Also be sure you know what the pre-harvest interval (PHI) is for the product you choose.  Some of these products cannot be harvested for 7, 14, or more days after application for forage. Additional fungicide options may be found in A3646, Pest management in Wisconsin Field Crops. Again, read any labels VERY carefully to be sure that the product can be used for oats for hay and forage.

Given the upward limitations of forage yield ~2 to 3.5 t DM/a it is difficult to know what dry matter differences we can expect; however, the most likely benefit of a fungicide application on forage oats would be in forage quality. Given the market prices and lack of cash flow in agriculture right now if a grower chose to do this practice a lower cost product that was efficacious on the oat crown rust would be the best choice.

Author Note: Mention of product names above is not an endorsement for that product.

2019 Pest Management Update Meeting Series Announced

The schedule for the 2019 Wisconsin Pest Management Update meeting series has been set. Presentations will include agronomic pest management information for Wisconsin field and forage crops. Speakers include Mark Renz and Rodrigo Werle, weed scientists, Damon Smith, plant pathologist, and Bryan Jensen, entomologist.

The format will be the same as in recent years. Meetings will either be in the morning or afternoon on November 4-8, 2019. Simply choose a day/location to attend with each meeting running 3 hours. Note that several locations and contacts have changed since 2018 (marked with * in the meeting flier). Please read the informational flier carefully and make sure you contact the appropriate person at your desired location.

2019 Pest Management Update Highlights:

Integrated Pest Management Updates in corn, soybeans, alfalfa, and small grains: Update on new products and/or use of existing products as well as brief highlights of the 2019 pest situations in each crop.

Please make your reservation with the host contact at least one week prior to the scheduled meeting date.

Three hours of Certified Crop Advisor CEU credits in pest management are requested for each session.

To download a PDF of the flier, CLICK HERE.

Tar Spot Now Confirmed in Wisconsin in 2019

Damon Smith, Extension Field Crops Pathologist, Department of Plant Pathology, University of Wisconsin-Madison

Hannah Reed, Graduate Research Assistant, Department of Plant Pathology, University of Wisconsin-Madison 

Brian Mueller, Assistant Researcher, Department of Plant Pathology, University of Wisconsin-Madison 

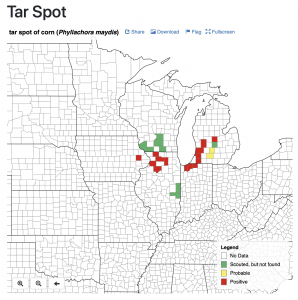
Figure 1. Corn IPM PIPE tar spot occurrence map as of August 7, 2019.

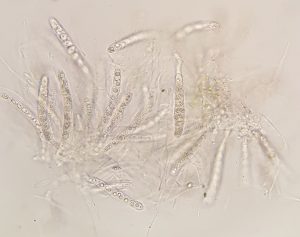
Tar spot has been found on corn in plots established to monitor for the disease in Arlington (Columbia Co.) and Lancaster (Grant Co.) WI (Fig. 1). In both cases the disease was present on hybrids known to be susceptible. At the Arlington location disease was found in just one small area of the field. Tar spot coverage was low to moderate on a few leaves (Fig. 2). Microscopy was used to observe ascospores from stromata, thus confirming the tar spot fungus (Fig. 3).

Figure 2. Tar spot on a leaf of corn located in Arlington, WI on August 7, 2019.

Tar spot was very hard to find in the Lancaster location. However, it was observed on several plants in one monitoring plot. In each case only 1-2 spots were observed.

What does this mean for you?

Figure 3. Asci and Ascospores of the tar spot fungus.

This means it is time to get back out and scout corn fields for tar spot. If you have had a history of tar spot and you know that you have a hybrid that is more susceptible and there is a large amount of infested residue, then you should monitor this situation closely. If tar spot is observed and you are irrigating or have had frequent rain, monitor this situation very closely. Tar spot seems to progress quickly in irrigated environments. Remember, that the window of opportunity to treat with a fungicide can pass rapidly as this disease can move quickly. Protecting this ear leaves before R3 can be important for preserving yield. There are many products that have demonstrated decent efficacy toward tar spot. You can find our 2018 fungicide test summaries by CLICKING HERE and scrolling down to pages 2-7. Work with your local extension personnel if you need help diagnosing the disease or need advice on spraying fungicides.

Wisconsin Mid-Season Corn Disease Update – August 2, 2019

Damon Smith, Extension Field Crops Pathologist, Department of Plant Pathology, University of Wisconsin-Madison

The Tar Spot Situation

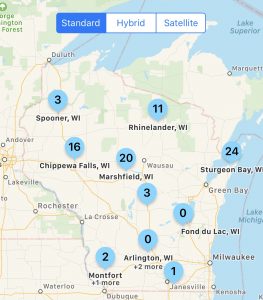
Figure 1. Tarspotter risk predictions for the state of Wisconsin on August 2, 2019.

Figure 1 shows the calculated risk from Tarspotter for August 2, 2019, for various locations in Wisconsin. As you can see, the present risk remains very low for most of the state. Continued warm and dry conditions have kept the risk low in Wisconsin. Tar spot is favored by persistent temperatures between 60 and 70 F and high relative humidity averaging above 75% for a 30-day period. We continue to scout fields in southern and southwestern WI and continue to find no tar spot in our travels. Tar spot has been observed now in multiple counties in Illinois, Indiana, and Michigan, along with one county in Iowa (Fig. 2). Continued dry weather is expected to keep this disease at non-existent or low levels in Wisconsin for the next couple of weeks.

Other Corn Diseases To Watch in Wisconsin

Figure 2. Corn IPM PIPE tar spot occurrence map as of August 2, 2019.

We continue to frequently find gray leaf spot (GLS) on corn. This disease is going to be problematic on some hybrids and in certain environments in Wisconsin. We are seeing GLS on ear leaves and severity is increasing. Remember, if you are going to spray fungicide, the idea is to spray preventatively before the disease reaches the ear leaves. Continue to scout fields and look in the lower canopy and watch movement of the pathogen and disease symptoms up the canopy. Optimal fungicide application timing if disease is progressing will be between VT and R3. See my previous article about making the fungicide spray decision.

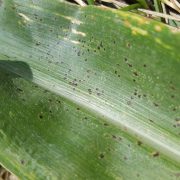
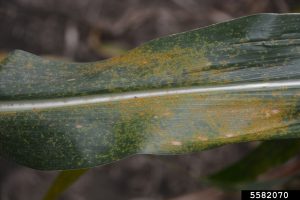
Figure 3. Common rust on Corn. Photo Credit: Daren Mueller, Iowa State University, Bugwood.org

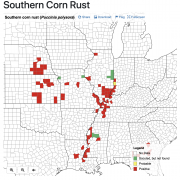
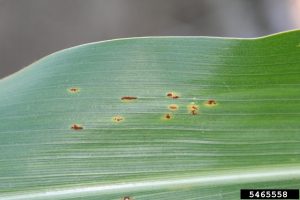
Southern rust has also been on our minds recently in Wisconsin. The disease is is caused by the fungus Puccinia polysora. Symptoms of southern rust are different from common rust (Fig. 3) in that they are typically smaller in size and are often a brighter orange color (Fig. 4). Pustules of southern rust also typically only develop on the upper surface and will be be more densely clustered. Favorable conditions for southern rust development are similar to those for common rust. high humidity and temperatures around 80F encourage disease development. However, very little free moisture is needed for infection to occur. Southern rust is typically a late-arriver in Wisconsin. When it does move in, it is usually in the southern and south-western portions of the state. Spores of this fungus have to be blown up from tropical regions or from symptomatic fields in the southern U.S. The fungus can not overwinter in Wisconsin. While southern rust epidemics can be rare events in Wisconsin, the disease can be serious when it occurs. In addition, when it occurs close to sinking, yield loss from the disease can be high. Thus, close monitoring of forecasts and scouting are needed to make timely in-seaosn management decision.

Figure 4. Southern rust on corn. Photo Credit: Emmanuel Byamukama, South Dakota State University, Bugwood.org

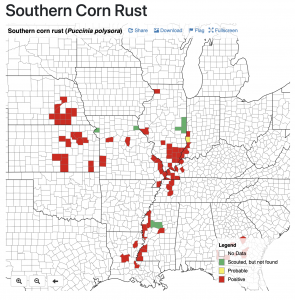
Currently the Corn Southern Rust iPIPE map is showing numerous confirmed cases of southern rust to our south, including an observations in a far northern Illinois county (Fig. 5). No confirmed cases have been identified in Wisconsin. However, close attention should be paid to this disease in 2019 as the confirmed cases this year have been earlier than in the past. This could mean that conditions are ripe for movement of southern rust inoculum into Wisconsin.

Management of Southern Rust

Figure 4. Corn IPM PIPE southern rust occurrence map for August 2, 2019.

Traditionally resistance was used to manage southern rust. However, in 2008 a resistance-breaking race of the southern rust fungus was confirmed in Georgia. Thus, most modern hybrids are considered susceptible to southern rust. Rotation and residue management have no effect on the occurrence of southern rust. The southern rust fungus has to have living corn tissue in order to survive and can not overwinter in Wisconsin. Fungicides are typically used to control southern rust in parts of the U.S. where this is a consistent problem. Efficacy ratings are also available for fungicides against southern rust on the Corn Fungicide Efficacy Table. Should southern rust make its way to Wisconsin prior to the “milk” (R3) growth stage in corn, it could cause yield reductions. Growers and consultants should scout carefully through the R3 growth stage and be sure to properly identify the type of rust observed. If you need assistance in identifying rust on corn, leaf samples of corn plants can be sent in a sealed plastic bag with NO added moisture to the University of Wisconsin Plant Disease Diagnostic Clinic (PDDC). Information about the clinic and how to send samples can be found by CLICKING HERE.

Other Useful Resources about Rusts on Corn

Purdue Extension Fact Sheet – Common and Southern Rusts of Corn

Video by Dr. Tamra Jackson-Ziems of the University of Nebraska – Identifying Rust Diseases of Corn

Wisconsin Soybean White Mold Update – August 1, 2019

Damon Smith, Extension Field Crops Pathologist, Department of Plant Pathology, University of Wisconsin-Madison

Shawn Conley, Extension Soybean and Small Grains Agronomist, Department of Agronomy, University of Wisconsin-Madison

Roger Schmidt, Nutrient and Pest Management Program, University of Wisconsin-Madison

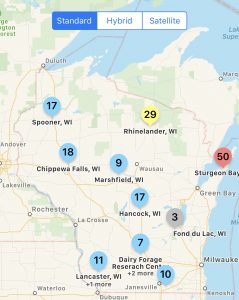
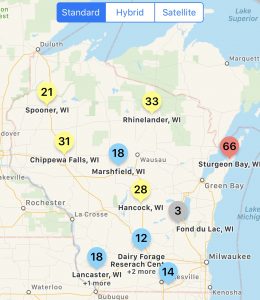
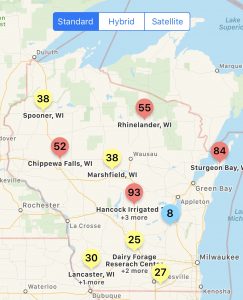
Figure 1. Sporecaster predictions for selected non-irrigated locations in Wisconsin for August 1, 2019.

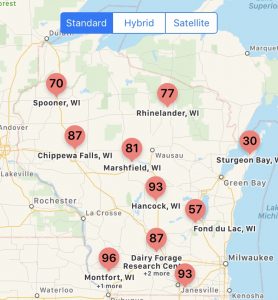
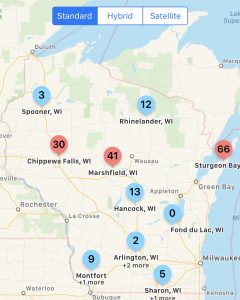
Figure 1 illustrates the calculated risk of white mold for select Wisconsin locations for non-irrigated soybeans, as determined by Sporecaster for August 1, 2019. This means that if soybeans are flowering and the area between rows is filled in more than 50%, risk is mostly low for the presence of apothecia and subsequent white mold development at this point in the season. Figure 2 illustrates calculated risk for the same locations for irrigated soybeans planted to 30-in row spacing. As you can imagine, risk is even higher for irrigated soybeans planted to 15-in rows.

Mild and dry conditions recently have pushed the risk down dramatically in non-irrigated fields. The UW Field Crops Pathology Team continues to scout white mold locations for apothecia. We have only observed apothecia in irrigated fields in the Hancock area.

I’m Ready To Spray, What Should I use?

Figure 2. Sporecaster predictions for selected irrigated locations with soybeans planted to 30″ row-spacing in Wisconsin for August 1, 2019.

If the canopy has met threshold, soybeans are flowering, and your Sporecaster risk is high, then a fungicide might be warranted. If you have decided to spray soybeans for white mold, what are the best products to use? Over the last several years we have run numerous fungicide efficacy trials in Wisconsin and in conjunction with researchers in other states. Applications should be targeted during the R1-R3 growth stages in soybean. Research has shown that applications outside these growth stages, are often less effective. In Wisconsin, we have observed that Endura applied at 8 oz at the R1 growth stage performs well. We have also observed that the fungicide Aproach applied at 9 fl oz at R1 and again at R3 also performs comparably to the Endura treatment. Other fungicide options also include Omega and Proline. You can view results of past fungicide evaluations for Wisconsin by CLICKING HERE. If you would like to run tailored estimations of return on investment for various fungicide programs, you can use another smartphone application called Sporebuster.

Helpful Smartphone Application Links

Sporecaster

  1. Click here to download the Android version of Sporecaster. 
  2. Click here to download the iPhone version of Sporecaster.
  3. Here is a helpful video if you would like some tips on how to use Sporecaster. If you would like some advice on how to interpret the output, we have created an additional short video on this subject.

Sporebuster

  1. Click here to download the Android version of Sporebuster.
  2. Click here to download the iPhone version of Sporebuster.
  3. Here is a video on how to use Sporebuster and interpret the output.

Other White Mold Resources

  1. To watch an in-depth video on white mold management, CLICK HERE.
  2. To find more information and download a fact sheet on white mold from the Crop Protection Network, CLICK HERE.

Wisconsin Corn Tar Spot and General Disease Update – July 18, 2019

Damon Smith, Extension Field Crops Pathologist, Department of Plant Pathology, University of Wisconsin-Madison

Figure 1. Tarspotter risk predictions for the state of Wisconsin on July 19, 2019.

Figure 1 shows the calculated risk from Tarspotter for July 19, 2019, for various locations in Wisconsin. As you can see, the present risk has dropped substantially over the past week, leaving much of the state at low risk. The drop is due to the high temperatures and drier conditions. Tar spot is favored by persistent temperatures between 60 and 70 F and high relative humidity averaging above 75% for a 30-day period. We have also scouted fields in southern and southwestern WI and have not found tar spot in our travels.

Gray Leaf Spot, Common Rust, and Northern Corn Leaf Blight, Oh My!

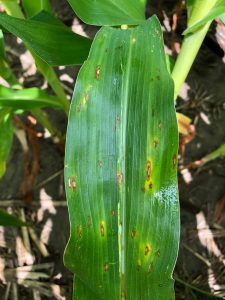
Figure 2. Gray leaf spot on a corn leaf.

While scouting we have observed other foliar diseases of corn, including gray leaf spot (GLS: Fig. 2), common rust (Fig. 3), and northern corn leaf blight (NCLB; Fig. 4). Out fo these three, GLS has been the most consistent to find in fields we have visited. In Grant Co., GLS has made its way to the mid-canopy of some corn planted no-till in a field that had corn last season. It will be important to keep an eye on GLS and NCLB over the next couple of weeks. These two disease can become yield limiting if they reach the ear leaf of corn at high severity levels before the R3 corn growth stage. Scouting to determine the number of plants showing symptoms and the severity will be important in determining if a fungicide application at the tasseling growth stage is needed. Right now I’m most concerned about GLS and NCLB in field corn in Wisconsin, while keeping an eye out for tar spot.

What Should I Spray, and When Should I Spray for Corn Foliar Diseases In Wisconsin? Fungicide should be used to preserve yield and reduce disease level. There is no silver bullet fungicide out there for all corn diseases. However, there are many products which work well on a range of diseases. The 2019 Corn Fungicide Efficacy table lists products that have been rigorously evaluated in university research trials across the country. You can see there are several products listed that perform well on both NCLB and GLS along with efficacy against tar spot. So obviously, if a disease is present and you are trying to control the disease, you might expect more return on your investment, compared to simply spraying fungicide and hoping that there might be a yield increase.

Figure 3. Common rust on a corn leaf.

Paul et al. (2011) conducted research to investigate the return on investment (ROI) of using fungicide at low and elevated levels of disease. Data from 14 states between 2002 and 2009 were used in the analysis. They looked at 4 formulations of fungicide products across all of these trials. I won’t go into detail about all products, but will focus on one here, pyraclostrobin. This is the active ingredient in Headline® Fungicide. In all, 172 trials were evaluated in the analysis and Paul et al. found that on average there was a 4.08 bu/acre increase in corn grain yield when pyraclostrobin was used. So there does appear to be some increase in yield with the use of fungicide over not treating across a range of environments. But in our current market, will this average gain cover the fungicide application? Today’s corn future price for September has a bushel of corn at $3.76.

Let’s Take a Closer Look at Corn Fungicide Return on Investment (ROI): While most of the early work on fungicide use in corn has focused on Headline® Fungicide, much of the industry has transitioned to using multi-mode-of-action products. These would be products mostly containing strobilurin (QoI) and triazole (DMI) fungicides in the same jug. Products such as Headline AMP® or Quilt Xcel® would fall into this category. These combination products have also been fairly consistent in response in my fungicide trials. You can find summaries of these trial results here. If we consider using Quit Xcel® at 10.5 fl oz or Headline AMP® at 10.0 fl oz, the list pricing of the product alone ranges from $15/acre (Quit Xcel®) to $22/acre (Headline AMP®). If the fungicide will be flown on with an aircraft, that cost will likely add nearly $15/acre to the application. Thus, fungicide plus application would range from $30/acre to $37/acre. If we can sell corn at $3.76 per bushel then we would need to preserve 8 bu/acre to nearly 10 bu/a in yield over not treating to break even! In a recent analysis of corn yield data where DMI+QOI products were applied at the tasseling period across the entire corn belt, the average yield preservation over not treating was 7.20 bu/a. This average projection is short of the 8 bu/a minimum we would need in the scenario above. However, the probability of preserving yield in the 8-10 bu/a range in this range is estimated to be 25% – 50%. This means that if we apply Quit Xcel® at 10.5 fl oz or Headline AMP® at 10.0 fl oz aerially, we will only break even 25% – 50% of the time with corn priced at $3.76 per bushel. If we can sell our corn for a better price or make the applications cheaper, then the odds will improve, but probably not climb above 70% even under the best case scenario. We do know that in Wisconsin, the odds of breaking even do improve if NCLB or GLS are active and increasing during the tasseling period. Get out there and scout!
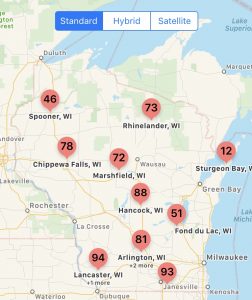
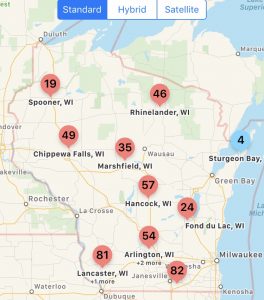

Figure 4. Northern corn leaf blight on a corn leaf.

So What About Fungicide Application Timing? We can investigate this question over the U.S. corn belt using the same dataset. Applications focused on an early (V6) timing, a VT-R2 timing, or a combination of V6 plus a VT-R2 application. Let’s again focus on the QoI+DMI products. Based on observations across the corn belt the V6 timing averaged almost 3 bu/a of preserved yield over not treating. The VT application resulted in nearly 8 bu/a in preserved yield, while the two-pass program only offered a little over 8 bu/a. Clearly the higher average yield preservation occurs using a single application of fungicide at the VT-R2 timing. Wisconsin data has been consistent with this observation. Thus it is recommended that a single application of fungicide be used around the VT-R2 growth stages, when NCLB or GLS are active and increasing on or near the ear leaves.

What About Silage Corn and Ear Rot? When it comes to ear rot control and reducing the accumulation of mycotoxins in grain or silage corn, fungicide application should be made when white silks are out. Spores of fungicide that generally cause mycotoxin issues in the grain portion of corn will infect the plant through silks. Thus, apply fungicides during silking or with 5 days after silking starts, can be beneficial. Note though that if the goal is to target mycotoxin production and reduce deoxynivalenol (DON) accumulation in the grain portion of the plant, Products containing a DMI should be used. Like winter wheat, the application of some QoI-containing fungicides can increase DON accumulation in the grain portion of corn plants. Some work has been done using Proline® to control Fusarium ear rot. This DMI only product has shown promise in reducing ear rot and DON accumulation in the grain portion of the corn plant and has a label for suppressing Fusarium ear rot in Wisconsin. Performance of some additional products in Wisconsin in a 2018 silage corn trial can be viewed by CLICKING HERE and scrolling down to pages 4 and 5.

Finally, be aware that in some cases, application of fungicide in combination with nonionic surfactant (NIS) at growth stages between V8 and VT in hybrid field corn can result in a phenomenon known as arrested ear development. The damage is thought to be caused by the combination of NIS and fungicide and not by the fungicide alone. To learn more about this issue, you can CLICK HERE and download a fact sheet from Purdue Extension that covers the topic nicely. Considering that the best response out of a fungicide application seems to be between VT-R2, and the issues with fungicide plus NIS application between V8 and VT, I would suggest holding off for any fungicide applications until at least VT.

Summary

As we approach the critical time to make decisions about in-season disease management on corn, it is important to consider all factors at play while trying to determine if a fungicide is right for your corn operation in 2019. Here is what you should consider:

1) Corn hybrid disease resistance score for NCLB and GLS – Resistant hybrids may not have high levels of disease which impact yield.

2) Get out of the truck and SCOUT, SCOUT, SCOUT – Consider how much disease and the level of severity of disease present in the lower canopy prior to tassel.

3) Consider weather conditions prior to, and during, the VT-R2 growth stages – if weather is conducive for NCLB or GLS, disease may continue to increase in corn and a fungicide application might be necessary. If it turns out to be hot and dry, disease development will stop and a fungicide application would not be needed.

4) Consider your costs to apply a fungicide and the price you can sell your corn grain – Will you preserve enough yield out of the fungicide application to cover its cost?

5) Hold off with making your fungicide application in Wisconsin until corn has reached the VT-R2 growth stages – The best foliar disease control and highest likelihood of a positive ROI will occur when fungicide is applied during this timing when high levels of disease are likely.

6) Be aware that every time you use a fungicide you are likely selecting for corn pathogen populations that will become resistant to a future fungicide application – Make sure your fungicide application is worth this long-term risk. See fact sheet A3878 below for more information.

Other Resources

Video: Disease Management in Low-Margin Years (fast forward to 10:00 for corn information)

Fact Sheet: A4137 – Grain Management Considerations in Low-Margin Years

Fact Sheet: A3878 – Fungicide Resistance Management in Corn, Soybeans, and Wheat in Wisconsin

References

Munkvold, G.P. and White, D.G., editors. 2016. Compendium of Corn Diseases, Fourth Edition. APS Press.

Paul, P. A., Madden, L. V., Bradley, C. A., Robertson, A. E., Munkvold, G. P., Shaner, G., Wise, K. A., Malvick, D. K., Allen, T. W., Grybauskas, A., Vincelli, P., and Esker, P. 2011. Meta-analysis of yield response of hybrid field corn to foliar fungicides in the U.S. Corn Belt. Phytopathology 101:1122-1132.

Wise, K., Mueller, D., Sisson, A., Smith, D., Bradley, and Robertson, A., editors. 2016. A Farmer’s Guide to Corn Diseases. APS Press.

Wisconsin Soybean White Mold Update – July 18, 2019

Damon Smith, Extension Field Crops Pathologist, Department of Plant Pathology, University of Wisconsin-Madison

Shawn Conley, Extension Soybean and Small Grains Agronomist, Department of Agronomy, University of Wisconsin-Madison

Roger Schmidt, Nutrient and Pest Management Program, University of Wisconsin-Madison

Figure 1. Sporecaster predictions for selected non-irrigated locations in Wisconsin for July 18, 2019.

Figure 1 illustrates the calculated risk of white mold for select Wisconsin locations for non-irrigated soybeans, as determined by Sporecaster for July 18, 2019. This means that if soybeans are flowering and the area between rows is filled in more than 50%, risk ranges from low to medium for the presence of apothecia and subsequent white mold development. Figure 2 illustrates calculated risk for the same locations for irrigated soybeans planted to 30-in row spacing. As you can imagine, risk is higher for irrigated soybeans planted to 15-in rows.

Extremely warm temperatures over the last week have pushed the risk down dramatically in non-irrigated fields. The UW Field Crops Pathology Team continues to scout white mold locations for apothecia. We have been unable to find apothecia at all locations we have visited over the last week.

I’m Ready To Spray, What Should I use?

Figure 2. Sporecaster predictions for selected irrigated locations with soybeans planted to 30″ row-spacing in Wisconsin for July 18, 2019.

If the canopy has met threshold, soybeans are flowering, and your Sporecaster risk is high, then a fungicide might be warranted. If you have decided to spray soybeans for white mold, what are the best products to use? Over the last several years we have run numerous fungicide efficacy trials in Wisconsin and in conjunction with researchers in other states. In Wisconsin, we have observed that Endura applied at 8 oz at the R1 growth stage performs well. We have also observed that the fungicide Aproach applied at 9 fl oz at R1 and again at R3 also performs comparably to the Endura treatment. Other fungicide options also include Omega and Proline. You can view results of past fungicide evaluations for Wisconsin by CLICKING HERE. If you would like to run tailored estimations of return on investment for various fungicide programs, you can use another smartphone application called Sporebuster.

Helpful Smartphone Application Links

Sporecaster

  1. Click here to download the Android version of Sporecaster. 
  2. Click here to download the iPhone version of Sporecaster.
  3. Here is a helpful video if you would like some tips on how to use Sporecaster. If you would like some advice on how to interpret the output, we have created an additional short video on this subject.

Sporebuster

  1. Click here to download the Android version of Sporebuster.
  2. Click here to download the iPhone version of Sporebuster.
  3. Here is a video on how to use Sporebuster and interpret the output.

Other White Mold Resources

  1. To watch an in-depth video on white mold management, CLICK HERE.
  2. To find more information and download a fact sheet on white mold from the Crop Protection Network, CLICK HERE.

Wisconsin Soybean White Mold Update – July 11, 2019

Figure 1. Sporecaster predictions for selected non-irrigated locations in Wisconsin for July 11, 2019.

Damon Smith, Extension Field Crops Pathologist, Department of Plant Pathology, University of Wisconsin-Madison

Shawn Conley, Extension Soybean and Small Grains Agronomist, Department of Agronomy, University of Wisconsin-Madison

Roger Schmidt, Nutrient and Pest Management Program, University of Wisconsin-Madison

Figure 1 illustrates the calculated risk of white mold for select Wisconsin locations for non-irrigated soybeans, as determined by Sporecaster for July 11, 2019. This means that if soybeans are flowering and the area between rows is filled in more than 50%, risk ranges from medium to high for the presence of apothecia and subsequent white mold development. Figure 2 illustrates calculated risk for the same locations for irrigated soybeans planted to 30-in row spacing. As you can imagine, risk is higher for irrigated soybeans planted to 15-in rows.

The UW Field Crops Pathology Team has started scouting white mold locations for apothecia. Overall, apothecia have not been observed at most locations, due to the fact that soybean canopies have not filled in to threshold. At only one location were we able to find apothecia and this location had met the canopy threshold. Remember, canopy closure is critical in calculating the probability of apothecial presence and subsequent white mold risk.

I’m Ready To Spray, What Should I use?

Figure 2. Sporecaster predictions for selected irrigated locations with soybeans planted to 30″ row-spacing in Wisconsin for July 11, 2019.

If the canopy has met threshold, soybeans are flowering, and your Sporecaster risk is high, then a fungicide might be warranted. If you have decided to spray soybeans for white mold, what are the best products to use? Over the last several years we have run numerous fungicide efficacy trials in Wisconsin and in conjunction with researchers in other states. In Wisconsin, we have observed that Endura applied at 8 oz at the R1 growth stage performs well. We have also observed that the fungicide Aproach applied at 9 fl oz at R1 and again at R3 also performs comparably to the Endura treatment. Other fungicide options also include Omega and Proline. You can view results of past fungicide evaluations for Wisconsin by CLICKING HERE. If you would like to run tailored estimations of return on investment for various fungicide programs, you can use another smartphone application called Sporebuster.

Helpful Smartphone Application Links

Sporecaster

  1. Click here to download the Android version of Sporecaster. 
  2. Click here to download the iPhone version of Sporecaster.
  3. Here is a helpful video if you would like some tips on how to use Sporecaster. If you would like some advice on how to interpret the output, we have created an additional short video on this subject.

Sporebuster

  1. Click here to download the Android version of Sporebuster.
  2. Click here to download the iPhone version of Sporebuster.
  3. Here is a video on how to use Sporebuster and interpret the output.

Other White Mold Resources

  1. To watch an in-depth video on white mold management, CLICK HERE.
  2. To find more information and download a fact sheet on white mold from the Crop Protection Network, CLICK HERE.