Wisconsin White Mold Risk Maps – July 29, 2018

Damon L. Smith, Extension Field Crops Pathologist, University of Wisconsin-Madison

**These maps are for guidance only and should be used with other sources of information and professional advice when determining risk of white mold development. For field-specific predictions, we encourage you to use the Sporecaster smartphone application. These predictions will be most accurate for your specific location. Information about Sporecaster and how to download can be found by clicking here. Sporecaster takes into account crop phenology, in addition to weather parameters, to make field-specific recommendations. The maps below are based on weather only and you must determine if your crop is currently phenologically at risk for infection. For more information on white mold and how to manage it, see my previous post.**


Map Legends: No color = model is inactive and risk of apothecia in the field is not likely; Gray = apothecia might be present, but likelihood of apothecial presence is extremely low; Blue = low risk of apothecia; Yellow = medium risk of apothecia in the field; Red = high risk of apothecia in the field. Model predictions must be combined with soybean growth stage and canopy characteristics to aid in timing of fungicide sprays.


Figure 1. White Mold Risk Map for Non-irrigated Fields – July 29, 2018

Cooler, dry weather has changed the white mold risk map over the last several weeks for non-irrigated (dryland or rain-fed) soybean fields (Figure 1). Cool weather has generated some areas of high risk in the southwest, western, and north-central regions of the state. However, the dry conditions have dissipated much of the moderate and low risk areas that showed several weeks ago. Risk in general is much more spotty than it has been. The soybean crop is also moving through growth stages much more rapidly than in 2017. Thus, the risk window for infection by the white mold fungus will end soon. Remember that once the crop has finished flowering risk of new infections is low to non-existent. In addition, late applications (R4 and later growth stages) of fungicide will not be needed for white mold control.


Figure 2. White Mold Risk Map for irrigated fields planted on 15″ row-spacing – July 29, 2018

Risk remains high across much of the state for irrigated soybeans planted to 15″ rows (Figure 2). Risk is starting to dissipate in areas in the east-central region, due to dryer conditions. However, a fungicide application should be considered if irrigating and soybeans are flowering and planted to a 15″ row-spacing. Note that if you have irrigation in your field but are not actually irrigating, you should be using the non-irrigated model above to make an accurate prediction of white mold risk.


Figure 3. White Mold Risk Map for irrigated fields planted on 30″ row-spacing – July 29, 2018

Risk of white mold in irrigated fields planted to 30″ row-spacing has decreased a bit in some areas, since the last post (Figure 3). However, Much of the state is at risk if irrigating on 30″ spaced soybeans. In these areas, a fungicide application should be considered if soybeans are being irrigated, canopy is nearly closed, and flowers are present. Note that if you have irrigation in your field but are not actually irrigating, you should be using the non-irrigated model above to make an accurate prediction of white mold risk.


These models were developed at the University of Wisconsin-Madison in conjunction with Michigan State University and Iowa State University to identify at-risk regions which have been experiencing weather favorable for the development of white mold fungus apothecia. Weather information and maps are provided by the Soybean Integrated Pest Information Platform for Extension and Education (iPIPE), which is managed by ZedX, Inc. These models predict when apothecia will be present in the field using combinations of 30-day averages of maximum temperature, relative humidity, and maximum wind speed. Using virtually available weather data, predictions can be made in most soybean growing regions. Based on these predictions, a map is generated under three scenarios (non-irrigated soybeans, soybeans planted on 15″ row-spacing and irrigated, or soybeans planted on 30″ row-spacing and irrigated). The maps are colored to show the likelihood of apothecial presence within a region.  If the model is predicting high risk (red) in your area for your planting scenario, the soybeans are flowering, and the canopy is somewhat closed, then the white mold risk is high. If your fields are at-risk, we recommend to consult your local extension personnel or other research-based resources for the best in-season management options for your area.

Wisconsin White Mold Risk Maps – July 15, 2018

Damon L. Smith, Extension Field Crops Pathologist, University of Wisconsin-Madison

**These maps are for guidance only and should be used with other sources of information and professional advice when determining risk of white mold development. For field-specific predictions, we encourage you to use the Sporecaster smartphone application. These predictions will be most accurate for your specific location. Information about Sporecaster and how to download can be found by clicking here. Sporecaster takes into account crop phenology, in addition to weather parameters, to make field-specific recommendations. The maps below are based on weather only and you must determine if your crop is currently phenologically at risk for infection. For more information on white mold and how to manage it, see my previous post.**


Map Legends: No color = model is inactive and risk of apothecia in the field is not likely; Gray = apothecia might be present, but likelihood of apothecial presence is extremely low; Blue = low risk of apothecia; Yellow = medium risk of apothecia in the field; Red = high risk of apothecia in the field. Model predictions must be combined with soybean growth stage and canopy characteristics to aid in timing of fungicide sprays.


Figure 1. White Mold Risk Map for Non-irrigated Fields – July 15, 2018

Hot, dry weather continues to push risk for white mold down in non-irrigated (dryland or rain-fed) soybean fields (Figure 1). While risk is high in some locations of the state, there is much more yellow on the map compared to last week, indicating medium risk. Continued areas of high risk are present along Lake Michigan and in the central and southwest portions of Wisconsin. In these areas, a fungicide application should be considered if the soybean canopy is nearly closed and flowers are present.

Figure 2. White Mold Risk Map for irrigated fields planted on 15″ row-spacing – July 15, 2018

Risk remains high across the state for irrigated soybeans planted to 15″ rows (Figure 2). A fungicide application should be considered if irrigating and soybeans are flowering and planted to a 15″ row-spacing. Note that if you have irrigation in your field but are not actually irrigating, you should be using the non-irrigated model above to make an accurate prediction of white mold risk.

Figure 3. White Mold Risk Map for irrigated fields planted on 30″ row-spacing – July 15, 2018

Risk of white mold in irrigated fields planted to 30″ row-spacing has increased significantly since last week (Figure 3). Much of the state is at risk if irrigating on 30″ spaced soybeans. In these areas, a fungicide application should be considered if soybeans are being irrigated, canopy is nearly closed, and flowers are present.


These models were developed at the University of Wisconsin-Madison in conjunction with Michigan State University and Iowa State University to identify at-risk regions which have been experiencing weather favorable for the development of white mold fungus apothecia. Weather information and maps are provided by the Soybean Integrated Pest Information Platform for Extension and Education (iPIPE), which is managed by ZedX, Inc. This model predicts when apothecia will be present in the field using combinations of 30-day averages of maximum temperature, relative humidity, and maximum wind speed. Using virtually available weather data, predictions can be made in most soybean growing regions. Based on these predictions, a map is generated under three scenarios (non-irrigated soybeans, soybeans planted on 15″ row-spacing and irrigated, or soybeans planted on 30″ row-spacing and irrigated). The maps are colored to show the likelihood of apothecial presence within a region.  If the model is predicting high risk (red) in your area for your planting scenario, the soybeans are flowering, and the canopy is somewhat closed, then the white mold risk is high. If your fields are at-risk, we recommend to consult your local extension personnel or other research-based resources for the best in-season management options for your area

To Spray or Not to Spray Fungicide on Corn for Grain or Silage?

Damon L. Smith, Extension Field Crops Pathologist, University of Wisconsin-Madison

Treating field corn, for grain, with fungicide has become a common practice in the Midwest. With so many fungicide programs and formulations, and the re-emergence of yield-limiting corn diseases, like northern corn leaf blight (NCLB) and gray leaf spot (GLS), foliar fungicide application has demonstrated an ability to reduce foliar disease severity and increase grain yield under some circumstances.

Figure 2: A computer simulation of 5% NCLB severity on a corn leaf.

Figure 1: A computer simulation of 5% NCLB severity on a corn leaf.

How do I know if disease is active at the time I want to spray?  While I hate talking about threshold levels for managing disease, it can be helpful in your decision making process to know what might be severe. While scouting look in the lower portion of the canopy. If some foliar disease symptoms are present in the lower canopy, make a visual estimation of how frequent (percentage of plants with lesions) the disease is in a particular area and how severe (how much leaf area is covered by lesions).  The lower leaves aren’t responsible for much yield accumulation in corn, but spores produced in NCLB and GLS lesions on these leaves can be splashed up to the ear leaves where disease can be very impactful. So by scouting the lower canopy and getting an idea of how much disease is present, you can “predict” what might happen later on the ear leaves to make an informed spray decision. The other consideration you should make while scouting is the resistance rating that the hybrid has for NCLB and/or GLS. If it is rated as resistant, then NCLB or GLS severity might not be predicted to get very severe, while in a susceptible hybrid, NCLB or GLS might be present on 50% or more of plants at high severity levels. Note however, that even if a hybrid is rated as resistant, it can still get some disease. Resistance isn’t immunity! If NCLB is present on at least half the plants and severity is at least 5-10% and weather is forecast to be rainy and cool, a fungicide application will likely be needed to manage the disease. So what does 5% leaf severity look like? Figure 1 is a computer generated image that shows 5% of the corn leaf with NCLB lesions. You can use this image to train your brain to visually estimate how severe the disease might be on a particular leaf. As for fungicide choice and timing, I consider that further below.

What fungicide should I spray and should I spray at all? My question is what are you trying to do? Control a disease or simply boost grain yield? Fungicide should be used as a tool to control a disease and preserve yield. There is no silver bullet fungicide out there for all corn diseases. However, there are many products which work well on a range of diseases. The Corn Fungicide Efficacy table lists products that have been rigorously evaluated in university research trials across the country. You can see there are several products listed that perform well on both NCLB and GLS. So obviously, if a disease is present and you are trying to control the disease, you might expect more return on your investment, compared to simply spraying fungicide and hoping that there might be a yield increase.

Paul et al. (2011) conducted research to investigate the return on investment (ROI) of using fungicide at low and elevated levels of disease. Data from 14 states between 2002 and 2009 were used in the analysis. They looked at 4 formulations of fungicide products across all of these trials. I won’t go into detail about all products, but will focus on one here, pyraclostrobin. This is the active ingredient in Headline® Fungicide. In all, 172 trials were evaluated in the analysis and Paul et al. found that on average there was a 4.08 bu/acre increase in corn grain yield when pyraclostrobin was used. So there does appear to be some increase in yield with the use of fungicide, but in our current market, will this average gain cover the fungicide application?


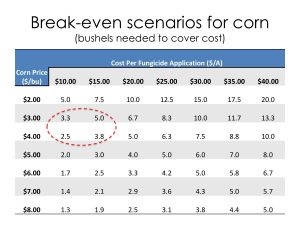
Figure 2. Break-even scenarios for corn when foliar fungicide was applied.

The suggested application rate for Headline® Fungicide is 6 to 12 fl oz/acre. My latest cost sheets indicate that at the 6 fl oz/acre rate, the cost of the product alone would be about $12/acre. Note that this does not include the custom applicator cost. This is a variable expense that would need to be added in to get an accurate ROI for your operation. Today we can estimate that we might sell corn grain somewhere between $3 and $4 per bushel. We can then use the cost of the fungicide product and the price of grain to figure out how many bushels of corn we need to make in the crop that would be treated with pyraclostrobin vs. not treating. Figure 2 is a table with various corn prices along the vertical axis and fungicide costs per acre along the horizontal axis. The cells indicate the bushels of corn per acre needed to break even when using a fungicide at the corresponding cost and corn grain sale price. Using the above scenario, we see that with corn priced between $3 and $4 per acre and a fungicide application cost of $between$10 and $15/acre, we would need to gain 2.5 – 5.0 bushels per acre when using Headline® Fungicide in the current corn market. Obviously these calculations are for just one product, but you can do the same for your farm and fungicide program and use the table to figure out what break-even yield gain you will need to cover your costs.

What are the odds of getting that 2.5 to 5 bushel per acre yield gain when using Headline® Fungicide? Paul et al. went further and calculated the probability of return at various corn prices and fungicide costs. They did separate analyses for foliar disease severity less than 5% and greater than 5%. In our current corn market with around $3/bu corn prices and a cost of Headline® Fungicide at $15/acre (fungicide plus custom application), Paul et al. found that at low foliar disease levels (<5% severity) the odds of a positive ROI using the fungicide would be around 50%. The odds of a positive ROI improve if disease severity is greater than 5%. In their calculations with higher levels of disease (>5% severity), the odds of a positive ROI would be between 60% and 70%. The morale of this story is that if you are going to use fungicides on corn, they should be targeted toward fields that will have, or are at risk, for disease!

So what about fungicide application timing? One of the best times to apply fungicide to maximize any benefits for grain corn is during tasseling (VT) and into the silking (R1-R2) timing. In multiple site-year studies across the corn belt of the U.S., application of fungicide on grain corn at VT resulted in over a 7 bu average yield gain. In Wisconsin, the average at the VT timing is about 5.5 bushels. However, this level of yield gain only materializes when a yield limiting foliar disease is active and moving up the canopy. You can check out results of the fungicide trials and the performance of various products over the last few years in Wisconsin by visiting my Fungicide Test Summaries page.

Finally, be aware that in some cases, application of fungicide in combination with nonionic surfactant (NIS) at growth stages between V8 and VT in hybrid field corn can result in a phenomenon known as arrested ear development. The damage is thought to be caused by the combination of NIS and fungicide and not by the fungicide alone. To learn more about this issue, you can CLICK HERE and download a fact sheet from Purdue Extension that covers the topic nicely. Considering that the best response out of a fungicide application seems to be between VT-R2, and the issues with fungicide plus NIS application between V8 and VT, I would suggest holding off for any fungicide applications until at least VT.

What about fungicide on corn for silage? This practice has been gaining increased interest over the last several years. Dr. Felipe Cardoso’s animal science laboratory at the University of Illinois has published several peer-reviewed papers describing the physiological changes in the corn plant treated with several fungicides, that result in improved feed quality. In those studies yield was often not directly impacted by the fungicide application, but fibrous changes in the corn plant improved feed conversion to milk production in cows fed silage corn treated with fungicide.

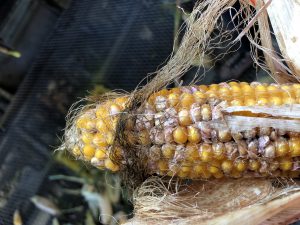
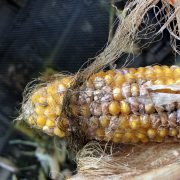
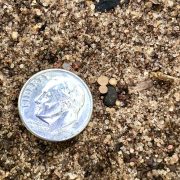
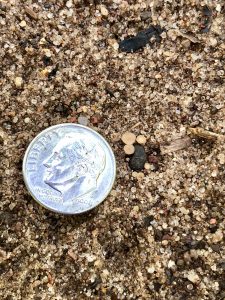
Figure 3. Ear rot of corn.

Another possible benefit to treating both silage corn and grain corn with fungicide is the potential reduction in mycotoxin accumulation. Mycotoxins are secondary metabolites produced by fungi. There are 400-500 different known mycotoxins. In corn in Wisconsin, we typically are most concerned with deoxynivalenol (DON or vomitoxin) and fumonisins. These mycotoxins are produced by fungi in the group Fusarium which can cause ear rot issues (Fig. 3) and also stalk rot issues in corn. Recent studies by colleagues in Ontario, Canada have demonstrated that the triazole containing fungicide Proline (active ingredient: prothioconazole) applied at R1 (silking), or shortly after the beginning of silking, can reduce DON levels in corn grain, compared to not treating. The Field Crops Pathology Laboratory at the University of Wisconsin-Madison set out to determine if Proline, and other fungicides and programs, had a similar effect on silage corn treated with fungicide.

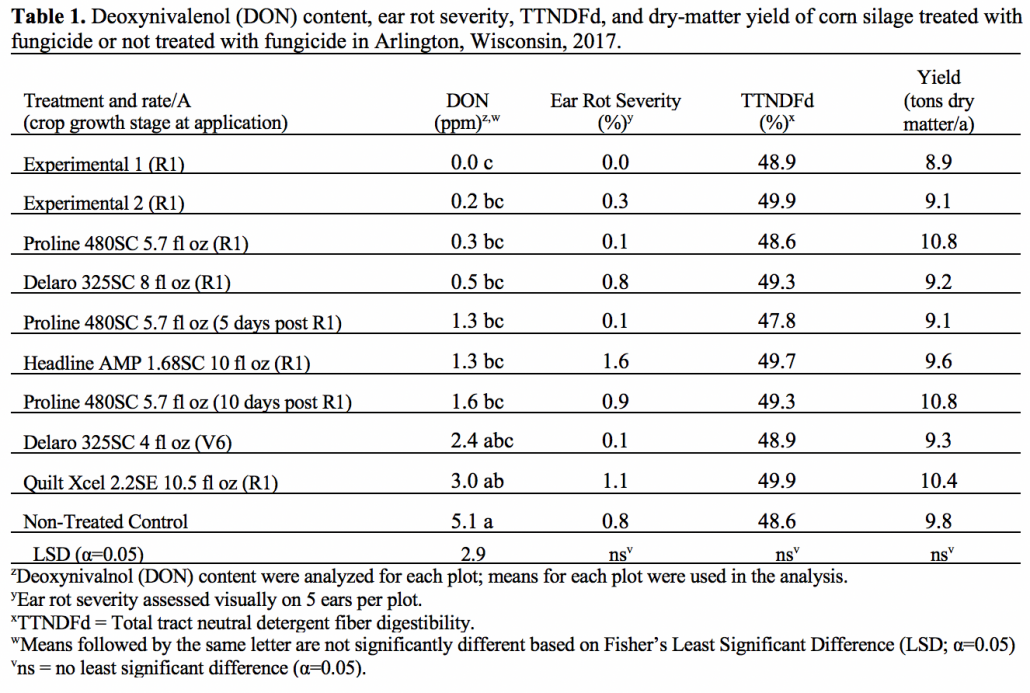
Our trial was established at the Arlington Agricultural Research Station located in Arlington, WI in 2017. The brown midrib (BMR) corn hybrid ‘P0956AMX’ was chosen for this study. Corn was planted on 11 May and chopped on 13 Sep. Single applications of various fungicide products (Table 1) were applied at growth stages V6 (19 Jun), R1 (26 Jul), 5 days post R1 (31 Jul), and 10 days post R1 (4 Aug). Ear rot severity was assessed by visually rating five ears per plot on the day of harvest. Yield was determined by harvesting the center two rows of each plot using a small plot silage chopper with an onboard platform weigh system. Chopped sub-samples were collected from each plot and analyzed for deoxynivalenol (DON) content.

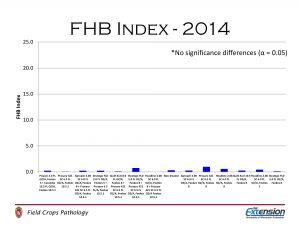
Consistent with other datasets, we found no significant difference in yield across treatments (Table 1). Likewise, little difference in quality could be found among all treatments. This could be due to the fact that we started with a high-quality BMR hybrid, thus not readily responding to physiological changes that correspond to increased feed quality when treated with fungicide.

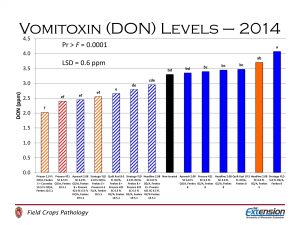
All fungicide treatments resulted in a significant reduction in DON content compared to the non-treated control, except Delaro applied at V6 and Quilt Xcel applied at R1. Application of the experimental 1 fungicide applied at R1 resulted in the lowest DON content among treatments. Remaining treatments had comparable DON levels to experimental 1 except for Quilt Xcel at R1. These results were consistent with previous data from Canada indicating that there is a “sweet spot” of application timing (especially when using Proline), when the goal is to reduce DON. The window of application begins at R1 (silking) and ends around 10 days after the start of R1.

Additionally, our data have shown that the product Quilt Xcel does not reduce DON levels on par with some other products. In fact, in other trials, Quilt Xcel has resulted in higher levels of DON in grain corn. In grass crops like wheat, it has been shown that products containing the strobilurin fungicide class can increase DON levels over not treating. Therefore, these products are not recommended for application after flowering in wheat. This same phenomenon could be possible in corn. Thus, care should be taken when choosing products and programs specifically aimed at reducing DON levels in corn silage.  

Summary

As we approach the critical time to make decisions about in-season disease management on corn, it is important to consider all factors at play while trying to determine if a fungicide is right for your corn operation. Here is what you should consider:

1) Corn hybrid disease resistance score – Resistant hybrids may not have high levels of disease which impact yield.

2) Get out of the truck and SCOUT, SCOUT, SCOUT – Consider how much disease and the level of severity of disease present in the lower canopy prior to tassel.

3) Consider weather conditions prior to, and during, the VT-R2 growth stages – if it is cool and wet, disease may continue to increase in corn and a fungicide application might be necessary. If it turns out to be hot and dry, disease development will stop and a fungicide application would not be recommended.

4) Consider your costs to apply a fungicide and the price you can sell your corn grain – Will you gain enough out of the fungicide application to cover its cost?

5) Hold off with making your fungicide application in Wisconsin until corn has reached the VT-R2 growth stages – The best foliar disease control and highest likelihood of a positive ROI will occur when fungicide is applied at VT when high levels of disease are likely.

6) Dairy farmers should think about the overall goal of using fungicide on silage corn. If the goal is to simply alter the corn plant physiologically to improve feed quality, there are numerous products and application timings that have the potential to provide a benefit over not treating. However, if the goal is to target mycotoxins, specifically DON, certain fungicide products may need to be applied specifically during the short silking stage (R1-R2) of the corn plant, to reduce DON levels.

7) Be aware that every time you use a fungicide you are likely selecting for corn pathogen populations that will become resistant to a future fungicide application – Make sure your fungicide application is worth this long-term risk. To learn more about fungicide resistance, you can CLICK HERE to download a UW Extension fact sheet.

Other Resources

Wisconsin Field Crops Fungicide Information Page

Applying Fungicides to Corn Early in Iowa

References

Haerr, K.J., Lopes, N.M., Pereira, M.N., Fellows, G.M., and Cardoso, F.C. 2015. Corn Silage from corn treated with foliar fungicide and performance of Holstein cows. J. Dairy Sci. 98:8962-8972.

Kalebich, C.C., Weatherly, M.E., Robinson, K.N., Fellows, G.M., Murphy, M.R., and Cardoso, F.C. 2017. Foliar fungicide (pyraclostrobin) application effects on plant composition of a silage variety corn. Animal Feed Science and Technology. 225:38-53.

Paul, P. A., Madden, L. V., Bradley, C. A., Robertson, A. E., Munkvold, G. P., Shaner, G., Wise, K. A., Malvick, D. K., Allen, T. W., Grybauskas, A., Vincelli, P., and Esker, P. 2011. Meta-analysis of yield response of hybrid field corn to foliar fungicides in the U.S. Corn Belt. Phytopathology 101:1122-1132.

White, D.G., editor. 2010. Compendium of Corn Diseases. APS Press.


Wisconsin White Mold Risk Maps – July 8, 2018

Damon L. Smith, Extension Field Crops Pathologist, University of Wisconsin-Madison

**These maps are for guidance only and should be used with other sources of information and professional advice when determining risk of white mold development. For field-specific predictions, we encourage you to use the Sporecaster smartphone application. These predictions will be most accurate for your specific location. Information about Sporecaster and how to download can be found by clicking here. Sporecaster takes into account crop phenology, in addition to weather parameters, to make field-specific recommendations. The maps below are based on weather only and you must determine if your crop is currently phenologically at risk for infection. For more information on white mold and how to manage it, see my previous post.**


Map Legends: No color = model is inactive and risk of apothecia in the field is not likely; Gray = apothecia might be present, but likelihood of apothecial presence is extremely low; Blue = low risk of apothecia; Yellow = medium risk of apothecia in the field; Red = high risk of apothecia in the field. Model predictions must be combined with soybean growth stage and canopy characteristics to aid in timing of fungicide sprays.


Figure 1. White Mold Risk Map for Non-irrigated Fields – July 8, 2018

Continued dry and windy weather is beginning to reduce the predicted risk of white mold across Wisconsin in non-irrigated (dryland or rain-fed) soybean fields (Figure 1). While risk is high in some locations of the state, there is much more yellow and blue on the map compared to last week, indicating medium to low risk. Over the next week, I expect risk to continue to dissipate as weather is predicted to remain warm and dry. Areas of high risk are present along Lake Michigan and in the central and southwest portions of Wisconsin. In these areas, a fungicide application should be considered if the soybean canopy is nearly closed and flowers are present.

Figure 2. White Mold Risk Map for irrigated fields planted on 15″ row-spacing – July 8, 2018

As you might expect, risk is much higher across the state for irrigated soybeans planted to 15″ rows (Figure 2). Remember that there are different models for irrigated and non-irrigated soybeans. Thus predictions can vary across the state in these environments. A fungicide application should be considered if irrigating and soybeans are flowering and planted to a 15″ row-spacing. Note that if you have irrigation in your field but are not actually irrigating, you should be using the non-irrigated model above to make an accurate prediction of white mold risk.

Figure 3. White Mold Risk Map for irrigated fields planted on 30″ row-spacing – July 8, 2018

Risk of white mold in irrigated fields planted to 30″ row-spacing is much a bit less than in 15″ spacing (Figure 3). However, areas of high risk are present in the southwest and far northern areas of soybean production. In these areas, a fungicide application should be considered if soybeans are being irrigated, canopy is nearly closed, and flowers are present.


These models were developed at the University of Wisconsin-Madison in conjunction with Michigan State University and Iowa State University to identify at-risk regions which have been experiencing weather favorable for the development of white mold fungus apothecia. Weather information and maps are provided by the Soybean Integrated Pest Information Platform for Extension and Education (iPIPE), which is managed by ZedX, Inc. This model predicts when apothecia will be present in the field using combinations of 30-day averages of maximum temperature, relative humidity, and maximum wind speed. Using virtually available weather data, predictions can be made in most soybean growing regions. Based on these predictions, a map is generated under three scenarios (non-irrigated soybeans, soybeans planted on 15″ row-spacing and irrigated, or soybeans planted on 30″ row-spacing and irrigated). The maps are colored to show the likelihood of apothecial presence within a region.  If the model is predicting high risk (red) in your area for your planting scenario, the soybeans are flowering, and the canopy is somewhat closed, then the white mold risk is high. If your fields are at-risk, we recommend to consult your local extension personnel or other research-based resources for the best in-season management options for your area

It’s Time for Fireworks and Spores To Fly: Independence Week in Wisconsin Brings White Mold Management Decisions

Damon Smith, Extension Field Crops Pathologist, Department of Plant Pathology, University of Wisconsin-Madison

Shawn Conley, Extension Soybean and Small Grains Agronomist, Department of Agronomy, University of Wisconsin-Madison

Roger Schmidt, Nutrient and Pest Management Program, University of Wisconsin-Madison

Figure 1. Apothecia, small mushroom-like structures of the white mold fungus that give rise to spores, which infect soybean flowers. Note the small pale orange structures to the right of the dime.

The week of Independence day is here and we are all looking forward to fireworks, festivities, and time with friends and family. This first week of July also brings us a heightened awareness of white mold in soybeans and its management. In 2017 we had one of the most epic white mold epidemics on record. Many high-yielding soybean fields in the state were slammed with white mold, resulting in some serious yield losses in many fields around Wisconsin. I have been asked many times this season, “Are we in for white mold as bad as 2017?” The short answer is no, I don’t think so.

Weather in 2017 was incredibly cool for the majority of the time. This had two effects which were responsible for the extreme white mold epidemic in 2017. First, soybeans moved extremely slow through each growth stage. This meant that the flowering window went on for about twice as long as normal for many of the varieties of soybeans we grow here in Wisconsin. This extended flowering period resulted in an extended period of time that soybeans were susceptible to infection. Remember that the white mold fungus infects soybeans through open and senescing flower, by spores that are born from small mushroom-like structures called apothecia (Fig. 1). This extended bloom period meant that the window of opportunity for the fungus was also extended. Couple this with the fact that those same cool conditions were also optimal for the fungus to infect and grow. It was a double whammy in 2017.

In 2018, the season has already seen several instances of 2 or 3 day durations of high temperatures of 90F or above. This has done a couple of things. It has pushed the soybean crop very quickly this year. I estimate that the crop is about 2 weeks ahead of last season, in the southern and south-central region of Wisconsin. With continued stretches of warm weather in the forecast, I expect flowering duration to be closer to ‘normal’, or at least shorter than last season. This means the crop won’t be subjected to such a long period of susceptibility, compared to 2017. Furthermore, these stretches of high temperatures of 90F or above should make conditions somewhat less conducive for the fungus. With that said, we need to pay attention to weather as we have had plenty of rain and humidity, which can be favorable for white mold. So will we have white mold in Wisconsin in 2018? Yes. Will it be has significant as 2017, I hope not.

Figure 2. White mold predictions for rain-fed (non-irrigated) fields for June 30, 2018. Blue indicates low risk, yellow medium risk, and red indicates high risk of infection for flowering soybeans.

Predicting White Mold

The flowering growth stages are a critical time to manage white mold in-season. You can view a fact sheet and video on the subject. As you probably know, timing in-season fungicide sprays at the correct time during the soybean bloom period can be extremely difficult. To help solve this decision-making issue, models were developed at the University of Wisconsin-Madison in conjunction with Michigan State University and Iowa State University to identify at-risk regions which have been experiencing weather favorable for the development of white mold apothecia. These models predict when apothecia will be present in the field using combinations of 30-day averages of maximum temperature, relative humidity, and wind speed. Using virtually available weather data, predictions can be made in most soybean growing regions. In past years we have overlaid model outputs onto maps to achieve a landscape view of the current risk. An example of a current map for this season is in figure 2. You can see we have some areas of favorable weather for white mold risk. However, more precise predictions would help determine the site-specific risk. To facilitate more precise predictions, we have launched the Sporecaster smartphone application for Android and iPhone for the 2018 season.

The purpose of the app is to assist farmers in making early season management decisions for white mold in soybean. The best time to spray fungicides for white mold is during flowering (R1 and R3 growth stages) when apothecia are present on the soil surface.

Sporecaster uses university research to turn a few simple taps on a smartphone screen into an instant forecast of the risk of apothecia being present in a soybean field, which helps growers predict the best timing for white mold treatment during the flowering period.

University research has indicated that the appearance of apothecia can be predicted using weather data and a threshold of percent soybean canopy row closure in a field. Based on these predictions and crop phenology, site-specific risk values are generated for three scenarios (non-irrigated soybeans, soybeans planted on 15″ row-spacing and irrigated, or soybeans planted on 30″ row-spacing and irrigated). Though not specifically tested we would expect row-spacings of 22 inches or less to have a similar probability response to fungicide as the 15 inch row-spacing.

The Sclerotinia apothecial models that underlie the Sporecaster prediction tool have undergone significant validation in both small test plots and in commercial production fields. In 2017, efficacy trials were conducted at agricultural research stations in Iowa, Michigan, and Wisconsin to identify fungicide application programs and thresholds for model implementation. Additionally, apothecial scouting and disease monitoring were conducted in a total of 60 commercial farmer fields in Michigan, Nebraska, and Wisconsin between 2016 and 2017 to evaluate model accuracy across the growing region. Across all irrigated and non-irrigated locations predictions during the soybean flowering period (R1 to early R4 growth stages) were found to explain end-of-season disease observations with an accuracy of 81.8% using the established probability thresholds now programmed in the app.

Click here to download the Android version of Sporecaster. 

Click here to download the iPhone version of Sporecaster.

Here is a helpful video if you would like some tips on how to use Sporecaster. If you would like some advice on how to interpret the output, we have created an additional short video on this subject.

What to Spray for White Mold?

If you have decided to spray soybeans for white mold, what are the best products to use? Over the last several years we have run numerous fungicide efficacy trials in Wisconsin and in conjunction with researchers in other states. In Wisconsin, we have observed that Endura applied at 8 oz at the R1 growth stage performs well. We have also observed that the fungicide Aproach applied at 9 fl oz at R1 and again at R3 also performs comparably to the Endura treatment. Other fungicide options also include Omega and Proline. You can view results of past fungicide evaluations by CLICKING HERE.

Some Other Resources

  1. For some other ideas on how to manage white mold you can visit this recent article.
  2. To find out how Xtend varieties respond against white mold, CLICK HERE.
  3. To watch an in-depth video on white mold management, CLICK HERE.

References

  1. Willbur, J.F., Fall, M.L., Blackwell, T., Bloomingdale, C.A., Byrne, A.M., Chapman, S.A., Holtz, D., Isard, S.A., Magarey, R.D., McCaghey, M., Mueller, B.D., Russo, J.M., Schlegel, J., Young, M., Chilvers, M.I., Mueller, D.S., and Smith, D.L.2018. Weather-based models for assessing the risk of Sclerotinia sclerotiorum apothecial presence in soybean (Glycine max) fields. Plant Disease.DOI:10.1094/PDIS-04-17-0504-RE
  2. Willbur, J.F.,Fall, M.L., Byrne, A.M., Chapman, S.A., McCaghey, M.M., Mueller, B.D., Schmidt, R., Chilvers, M.I., Mueller, D.S., Kabbage, M., Giesler, L.J., Conley, S.P., and Smith, D.L. 2018. Validating Sclerotinia sclerotiorumapothecial models to predict Sclerotinia stem rot in soybean (Glycine max) fields. Plant Disease. https://doi.org/10.1094/PDIS-02-18-0245-RE.
  3. Fall, M., Willbur, J., Smith, D.L., Byrne, A., and Chilvers, M. 2018. Spatiotemporal distribution pattern of Sclerotinia sclerotiorum apothecia is modulated by canopy closure and soil temperature in an irrigated soybean field. Phytopathology. https://doi.org/10.1094/PDIS-11-17-1821-RE.


Wisconsin Winter Wheat Disease Update – June 26, 2018

Damon Smith, Extension Field Crops Pathologist, Department of Plant Pathology, University of Wisconsin-Madison

Brian Mueller, Assistant Field Researcher, Department of Plant Pathology, University of Wisconsin-Madison

Figure 1. Fusarium head blight of winter wheat

The Wisconsin Field Crops Pathology crew has scouted and rated all winter wheat variety trials across the wheat-growing region of the state. We have also looked at commercial fields for disease in the region. In general leaf diseases will be of minimal impact this season. We have observed a little Septoria leaf blotch in some fields in the lower canopy. However, this pathogen will not limit yield this season, as it has not reached the flag leaf yet. We have also not observed any stripe rust this season. As I mentioned in previous posts, the winter was cold enough with minimal snow cover, which didn’t allow the stripe rust pathogen to overwinter in the region. Subsequent spread from the southern states north, was also not fast enough to reach the crop in Wisconsin to impact yield. If stripe rust does arrive this season, it will not impact yield. Leaf rust was observed at the Arlington (south-central Wisconsin) location. However, it was at very low incidence and severity and will likely not impact yield on most varieties in the state.

Figure 2. Fusarium head blight index of winter wheat in small plots where fungicide programs were used in 2014.

Fusarium head blight (FHB; scab) has been observed at all locations visited. Incidence and severity is highly variable based on location. At the Sharon (southern Wisconsin) and Arlington locations, FHB could be found in some plots at incidence levels as high as 50% with 50% severity. Many plots had low levels of FHB, thus the average levels at these locations was around 10% incidence with severity levels of around 20%. As we moved north and east in Wisconsin, FHB was at much lower incidence and severity levels. Incidence averaged 5%-10% with severity around 15% at the Chilton and Fond du Lac locations. Commercial fields that we have scouted in these regions fall within these same averages.

Figure 3. Vomitoxin levels of finished grain from winter wheat small plots where fungicide programs were used in 2014.

While I don’t think the FHB epidemic in 2018 will be as bad as 2015, I think it is important to scout fields and understand the levels of FHB present. It will also be important to test finished grain for vomitoxin or DON. Often, the level of visible FHB damage does not reflect the vomitoxin levels of harvested grain. This happened in some fields in 2014, including a research trial that we had at the Arlington location. FHB index levels on heads in the field were very low across all treatments in our research trials that year (Fig. 2). However, when the finished grain was tested for vomitoxin, levels were quite high (Fig. 3). There are a number of factors that can contribute to this phenomenon, including time of infection, varieties, weather, and treatment. The point is, be sure this doesn’t happen to you. Scout AND have finished grain tested so you aren’t surprised at the elevator!

Welcome to badgercropdoc.com: A New Web Resource for Wisconsin Field Crops Pathology Research and Outreach

Damon Smith, Extension Field Crops Pathologist, Department of Plant Pathology, University of Wisconsin-Madison

Welcome to badgercropdoc.com! Badger Crop Doc is a one-stop-shop for all things Wisconsin Field Crops Pathology related. We have merged the website and blog found at / with our University of Wisconsin academic website, so that all information can now be found in one place. If you subscribed to the blog posts at /, don’t worry, we have already moved your e-mail over to badgercropdoc.com. Be sure that browsers are now pointed to the new URL and check your e-mail folders to be sure blog postings aren’t going to junk or trash. No new postings will be added to /.

BadgerCropDoc was made possible with support from the Wisconsin Soybean Marketing board and is meant to be complementary to badegrbean.com and coolbean.info, while offering research-based information for the major field crops of Wisconsin. We hope you enjoy this new resource. As always, please let us know what you think. We would love to hear feedback.

Wisconsin Winter Wheat Disease Update – June 6, 2018

Damon Smith, Extension Field Crops Pathologist, Department of Plant Pathology, University of Wisconsin-Madison

Brian Mueller, Assistant Field Researcher, Department of Plant Pathology, University of Wisconsin-Madison

The Wisconsin Field Crops Pathology Team has been busy scouting and rating diseases of winter wheat this past week across the major wheat growing region of the state. To be honest, it has been pretty boring for our group. We have seen virtually no disease in uniform variety trials or in production fields. This is good news for farmers, for sure.

We have not yet confirmed any stripe rust infections in the state of Wisconsin, this season. Reports from farmers and consultants are also consistent with our observations. This is a considerable change from last season, when we found our first stripe rust pustules at the end of March. This early epidemic in 2017 resulted in some considerable yield loss from stripe rust on winter wheat. Definitely not the case this season. We have also seen extremely low levels of Septoria leaf blotch in the lower portions of the canopy on some varieties. Cool dry weather is preventing this disease from really moving up the canopy. No other foliar diseases have been confirmed on winter wheat this season.

As for the Fusarium head blight (FHB; scab) situation, risk as calculated by the Fusarium Risk Tool, has dissipated over the past week. Two weeks ago, risk of FHB had been estimated to be high on susceptible cultivars. However, cool dry weather has driven the risk to low levels across much of the major wheat production area of Wisconsin. Risk is high still along the Lake Michigan shore and up into Door County. Also elevated and high risk are estimated in Northwest Wisconsin on susceptible cultivars. The situation should be monitored closely in these areas on any crop heading into anthesis. Most of the wheat we have looked at across the southern, south-central, and north-eastern wheat production area of the state is through anthesis or will be by the end of the week. The FHB risk is forecast to be low through this period, in these areas. We will begin scouting for FHB damage in the next week or so, but we anticipate FHB to be mostly low in many areas, with some isolated pockets of higher levels.

It is important to continue scouting over the next couple of weeks. We are transitioning away form making fungicide spray decisions, but it is important to determine the level of FHB present in a particular field, so that proper harvest preparations can be made. We will continue to update you on what we find over the next couple of weeks. However, this is the lowest level of disease on winter wheat I have seen since I have been in Wisconsin. Scout, Scout, Scout!

Wisconsin Winter Wheat Disease Update – May 30, 2018

Damon Smith, Extension Field Crops Pathologist, Department of Plant Pathology, University of Wisconsin-Madison

Brian Mueller, Assistant Field Researcher, Department of Plant Pathology, University of Wisconsin-Madison

Warm weather last week, which continued into this week, has pushed the winter wheat crop in Wisconsin toward heading. Most varieties planted in the southern or south-central region of Wisconsin are heading, with full emergence and anthesis (flowering) beginning by the end of the week. We suspect that winter wheat in the northern and northeastern portions of the Wisconsin wheat belt to not be far behind.

Now is the time to consider your Fusarium head blight (FHB; scab) management strategy. Weather late last week had driven the FHB risk on the Fusarium Head Blight Prediction Center to a high level for susceptible varieties. Extremely hot and dry weather has forced the risk back to “low” today. However, 72 hour forecasts show risk increasing to medium in much of the wheat belt with high risk in isolated pockets on susceptible varieties (see figure). Rain today, with continued humidity and temperatures in the 80s F for the rest of the week, will keep risk elevated. Areas near the Lake Michigan shore will likely be at high risk.

A fungicide may be needed especially on susceptible cultivars to control FHB and reduce DON (vomitoxin) contamination. The fungicides Prosaro or Caramba have both performed well on FHB in Wisconsin. Timing of application of these products is critical. I would urge you to wait until anthesis has begun in your field before applying. We have observed poor control where application of these effective fungicides were made before anthesis. In fact, we have observed improved control of FHB and lower levels of DON in finished grain where fungicide application was delayed 4-5 days after the beginning of anthesis, compared to applications at the start of anthesis. Data from a fungicide efficacy trial to support this observation can be found by clicking here and scrolling down to pages 16 and 17. Also, remember that application of fungicides should be made no later than 6-7 days after the start of anthesis. After this time, fungicide efficacy on FHB and DON control is much reduced.

Get out there and SCOUT, SCOUT, SCOUT and monitor the FHB Prediction Center!

Wisconsin Winter Wheat Disease Update – May 24, 2018

Damon Smith, Extension Field Crops Pathologist, Department of Plant Pathology, University of Wisconsin-Madison

Brian Mueller, Assistant Field Researcher, Department of Plant Pathology, University of Wisconsin-Madison

The heavy moisture we have received over the last week, combined with high temperatures in the low-to-mid 80s F this week have pushed winter wheat growth stages. We have seen rapid stem elongation with flag leaves emerging in some fields in the southern and south central regions of Wisconsin. We continue to find wheat with little foliar disease. However, we are entering a critical time to make our first important fungicide decision related to protecting emerging flag leaves from foliar disease. Continue to scout. Weather has been conducive for some foliar diseases. However, wheat continues to remain “clean” then hold your fungicide application until anthesis.

Given the heat this week, I suspect that heads will be emerging for some varieties in the southern region over the next week or so, with anthesis to closely follow. The decision to apply fungicide will be critical at this time. Considering the wet weather and warm temperatures the “pump is primed” for Fusarium head blight (FHB; scab). The Fusarium Head Blight Prediction Center currently has the FHB risk at medium to high in the south, south-central and eastern portions of the wheat belt (See Figure). This situation needs to be monitored closely over the next couple of weeks as fields enter the anthesis growth stage. The weather outlook appears to be very humid, wet, and warm, which will only increase the risk of FHB.

A fungicide may be needed especially on susceptible cultivars to control FHB and reduce DON (vomitoxin) contamination. The fungicides Prosaro or Caramba have both performed well on FHB in Wisconsin. Timing of application of these products is critical. I would urge you to wait until anthesis has begun in your field before applying. We have observed poor control where application of these effective fungicides were made before anthesis. In fact, we have observed improved control of FHB and lower levels of DON in finished grain where fungicide application was delayed 4-5 days after the beginning of anthesis, compared to applications at the start of anthesis. Data from a fungicide efficacy trial to support this observation can be found by clicking here and scrolling down to pages 16 and 17. Also, remember that application of fungicides should be made no later than 6-7 days after the start of anthesis. After this time, fungicide efficacy on FHB and DON control is much reduced.

Get out there and SCOUT, SCOUT, SCOUT and monitor the FHB Prediction Center!