Disease and Mycotoxin Considerations for Corn Silage Harvest In Wisconsin

Damon Smith, Extension Field Crops Pathologist, Department of Plant Pathology, University of Wisconsin-Madison

We are quickly approaching that time of year where we will see silage choppers working the 2024 corn crop. This means it is time to understand overall crop health and how diseases might be affecting the crop so that you can make the best silage product you can.

Overall, the corn crop in Wisconsin looks good. Yes, I can find some sort of disease in any field I visit, but I would say for the most part, most fields that were planted relatively on time, and didn’t experience early-season flooding, have a decent crop. With that said, we need to monitor the crop closely as we approach harvest as foliar disease issues can sneak up quickly as cool, wetter weather moves in near the early fall harvest.

Foliar diseases such as southern rust, tar spot, gray leaf spot (GLS), and northern corn leaf blight (NCLB) can be problematic for silage production. Not only do these diseases lead to a reduction in overall silage quality, they can force the plant to scavenge carbohydrates in the stalk which can result in standability issues and lodging. These diseases can also influence whole plant moisture making harvesting at optimal moisture difficult. If silage is harvested at sub-optimal moisture, then packing the bunker properly can be a challenge which can lead to slow fermentation and continued growth of aerobic organisms like fungi. This can indirectly lead to an increase in mycotoxins and “mold” issues from these aerobic fungi.

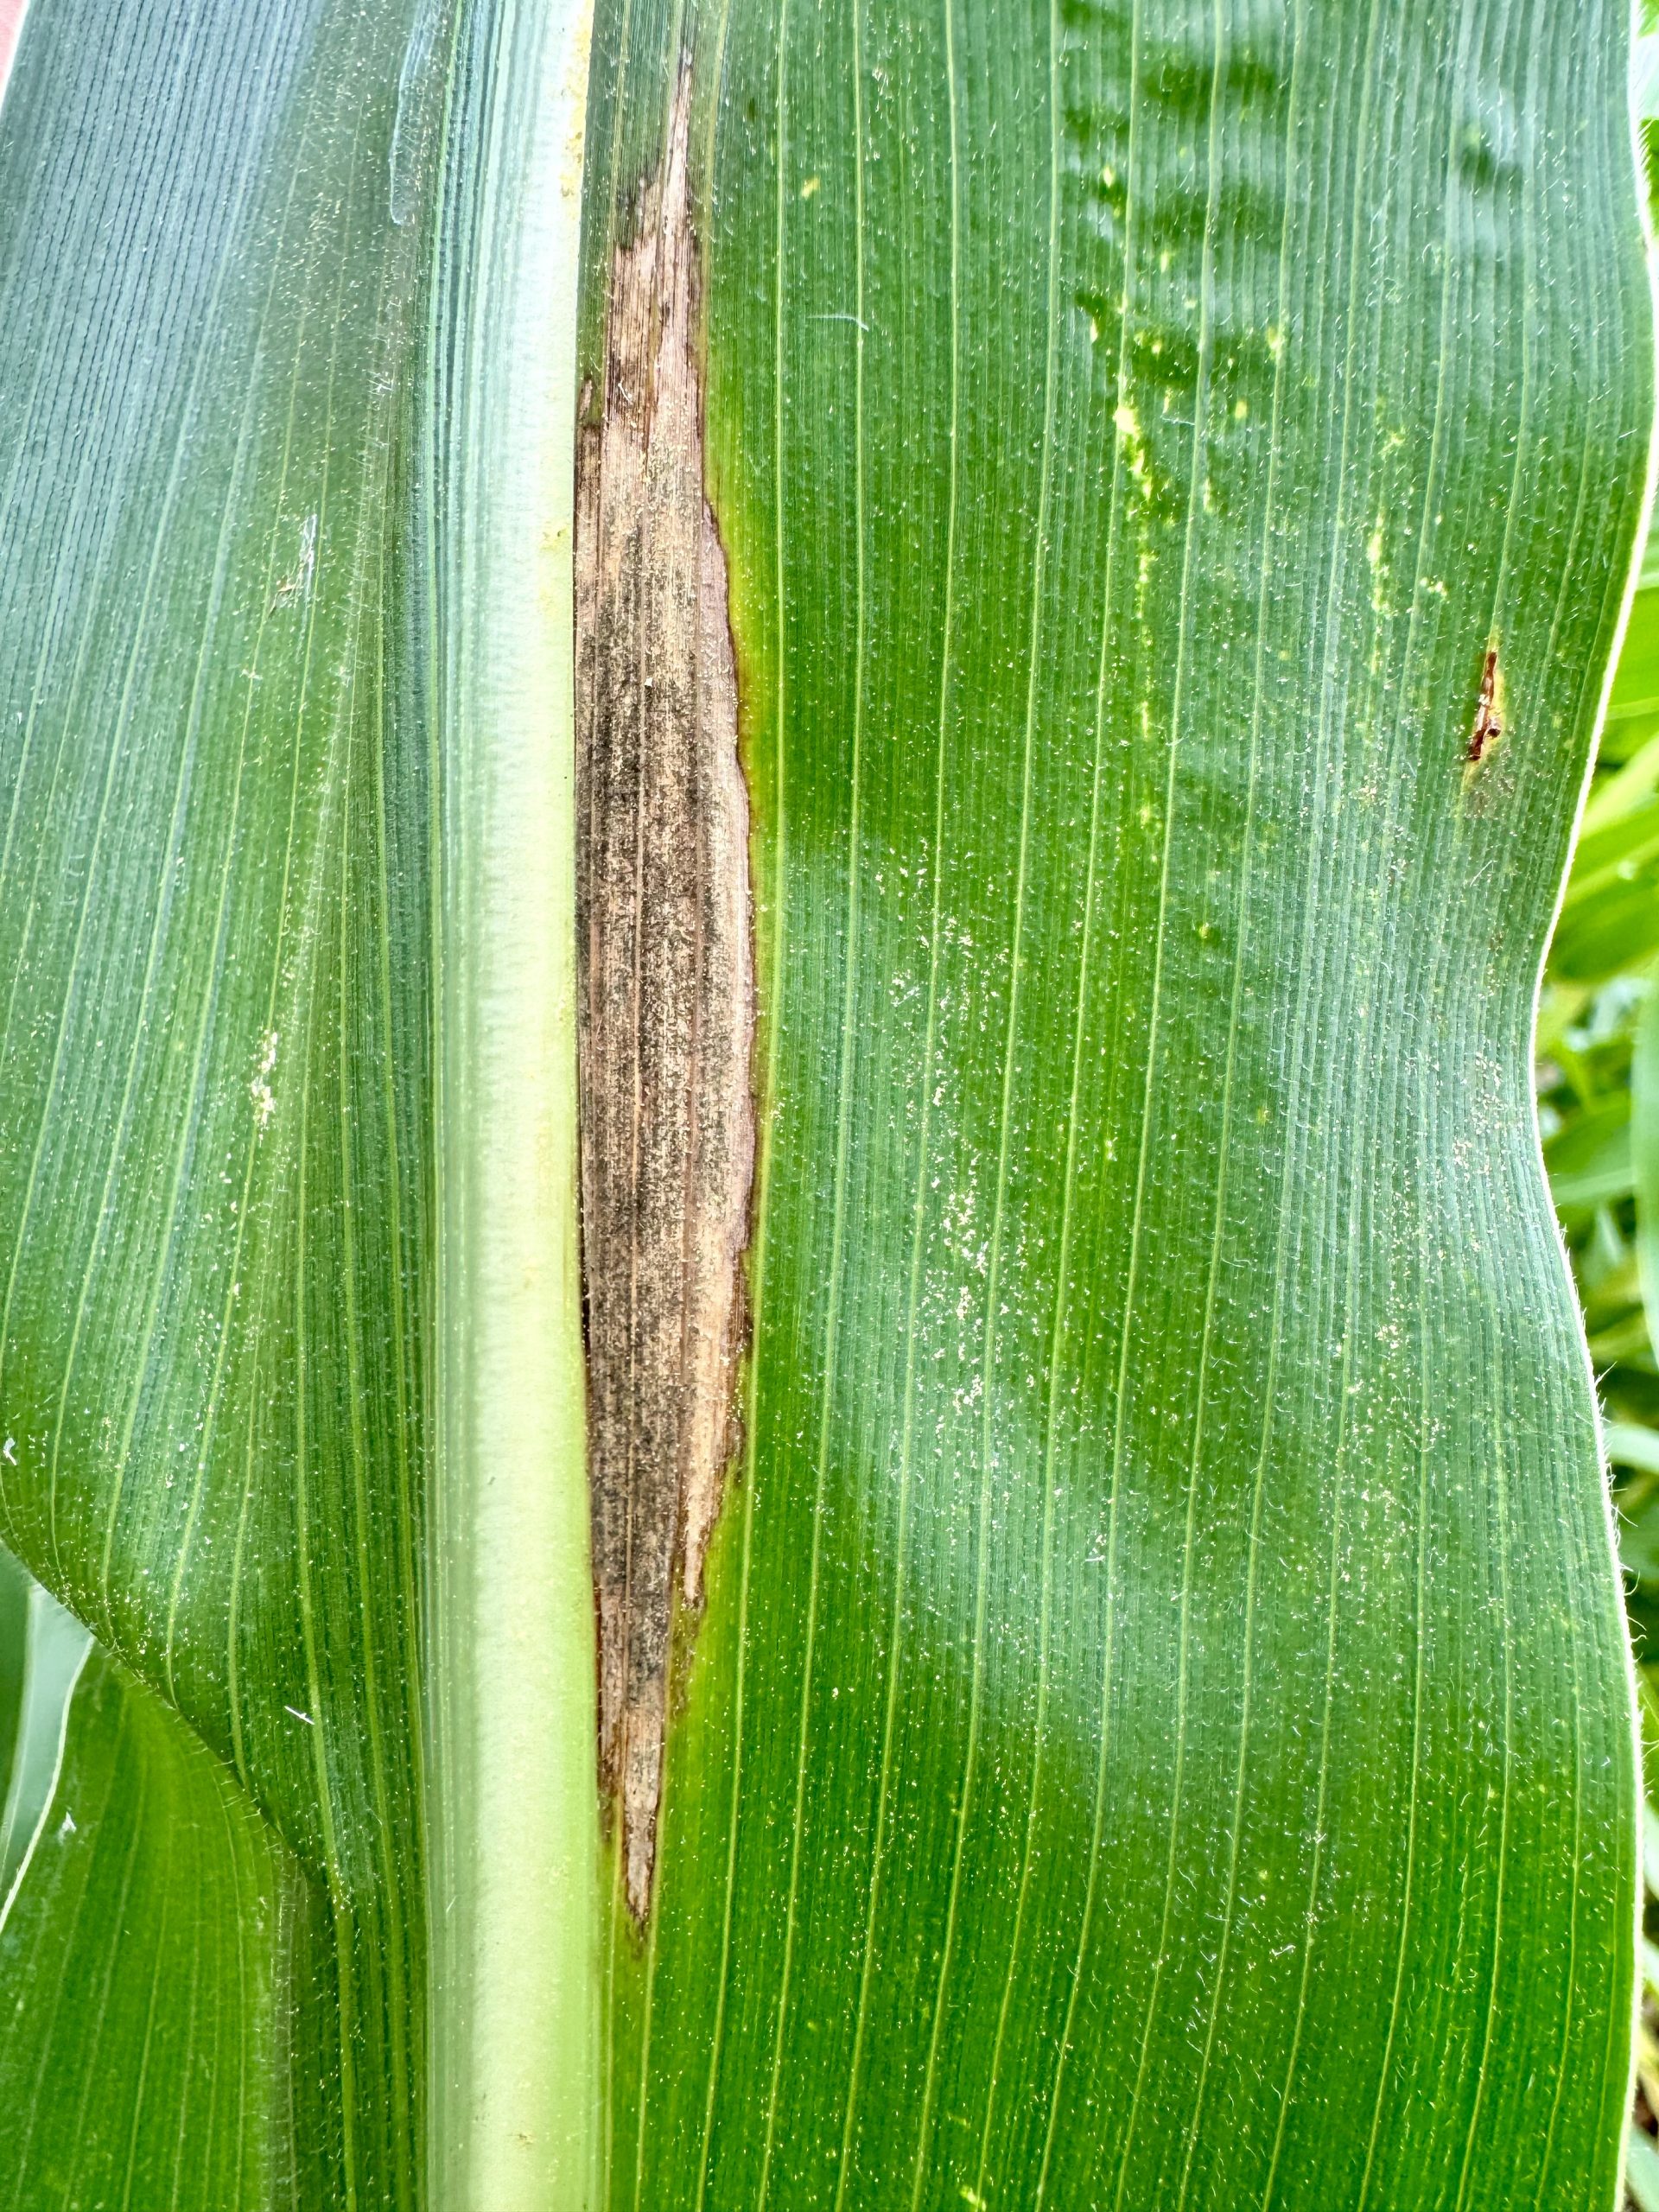
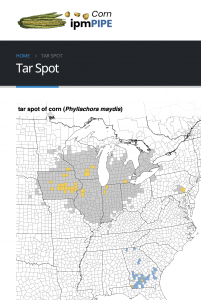
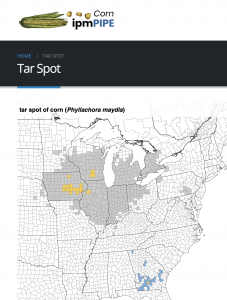
Tar spot and silage harvest

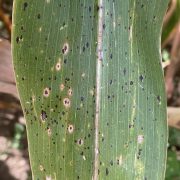
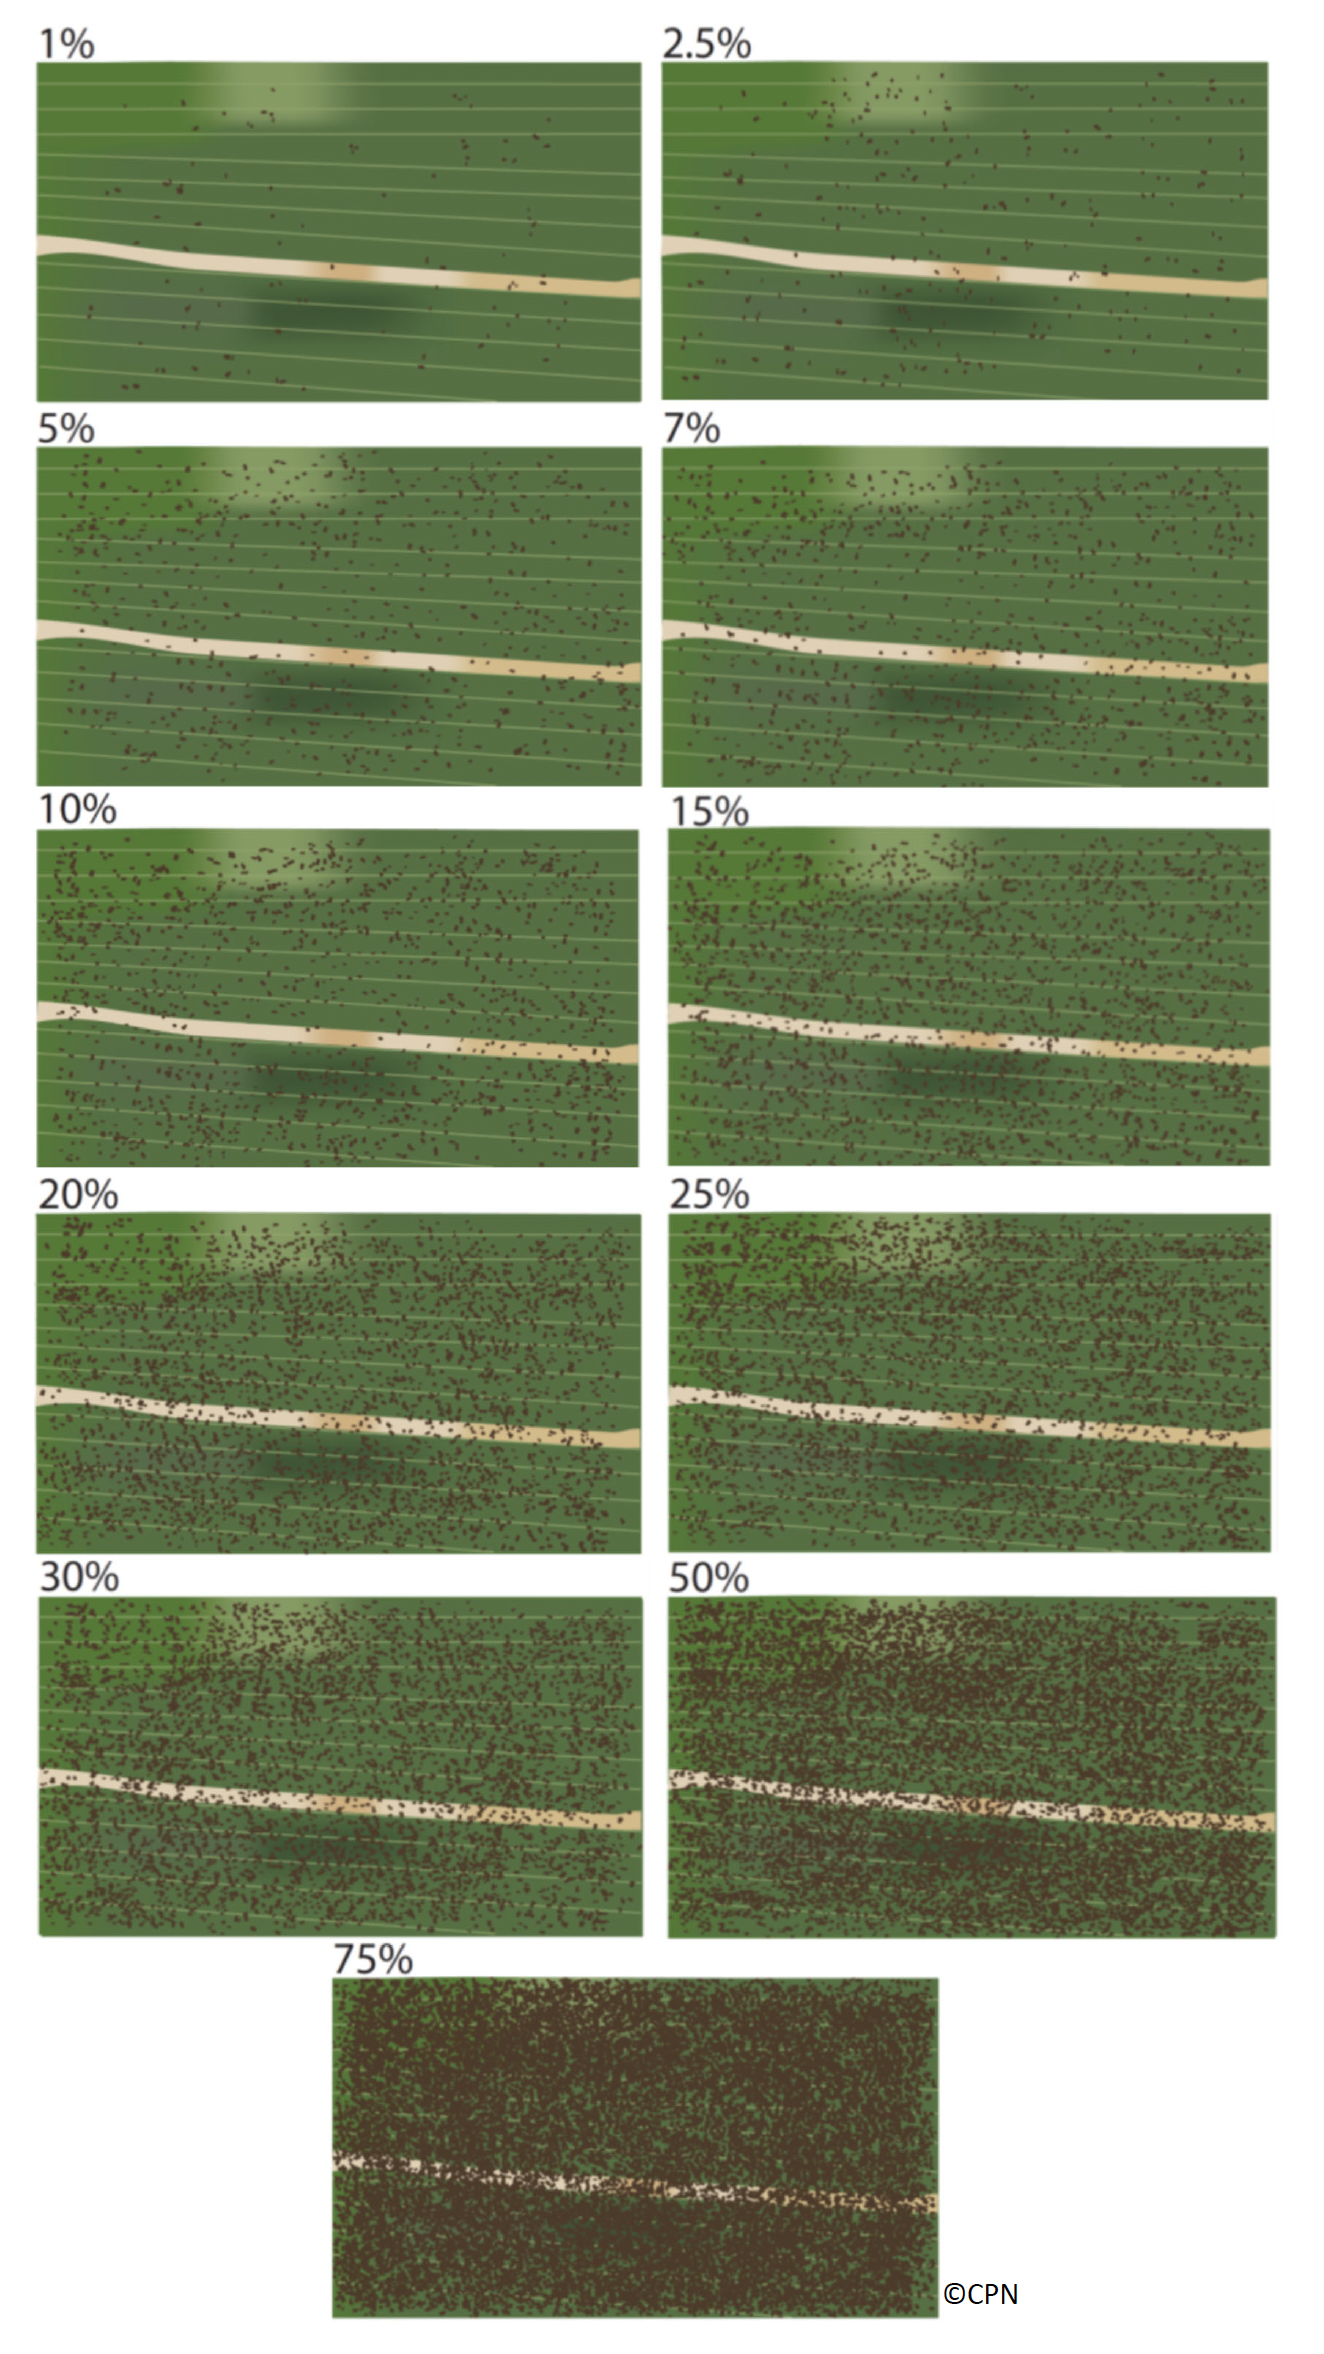
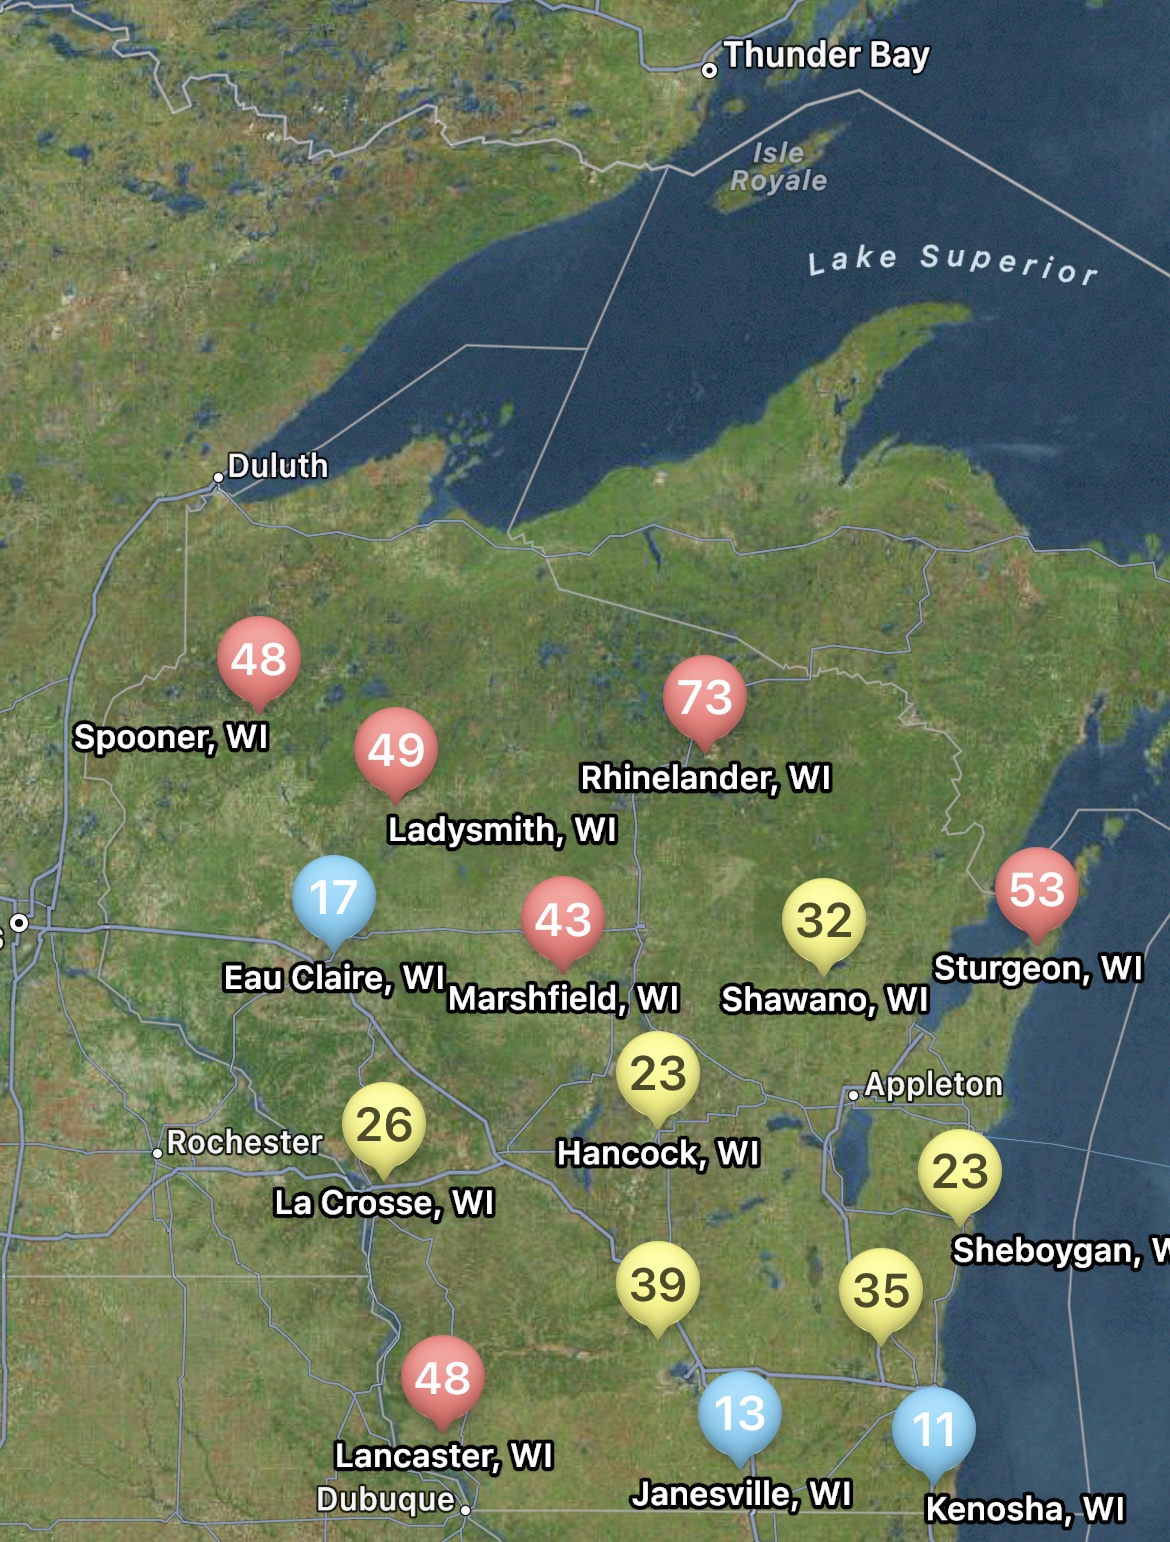
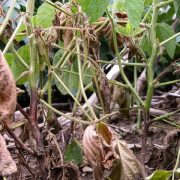
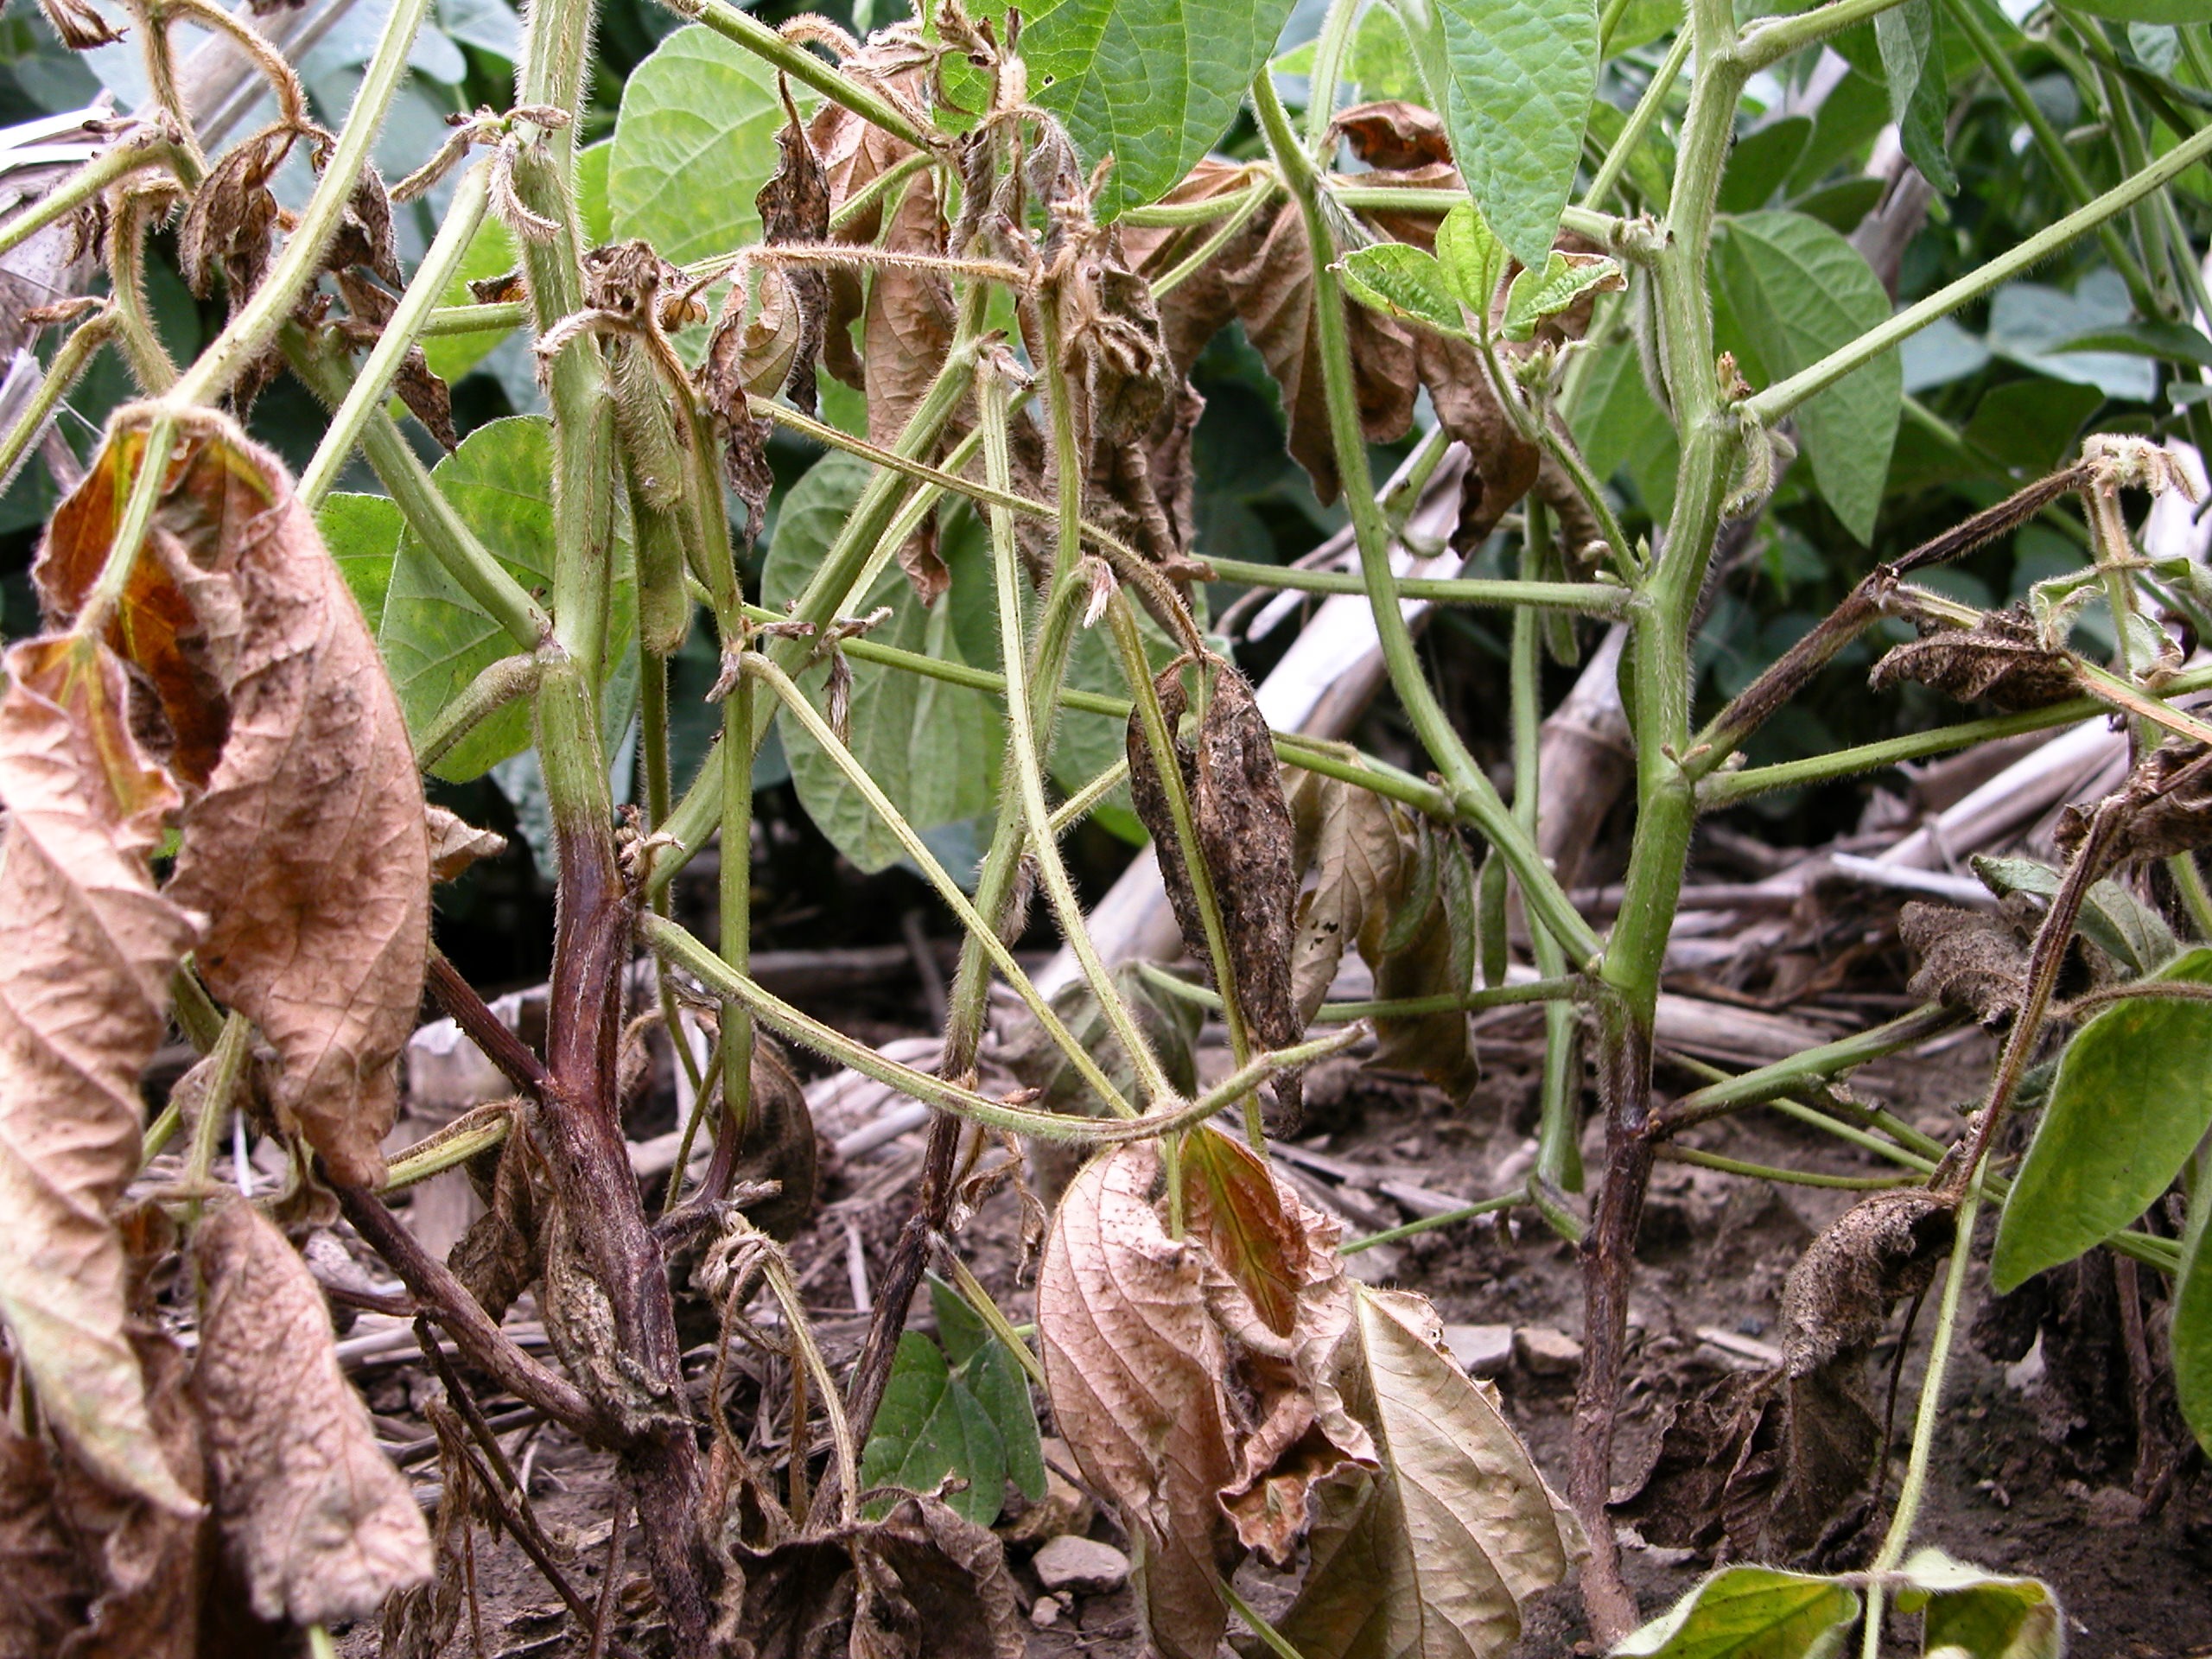
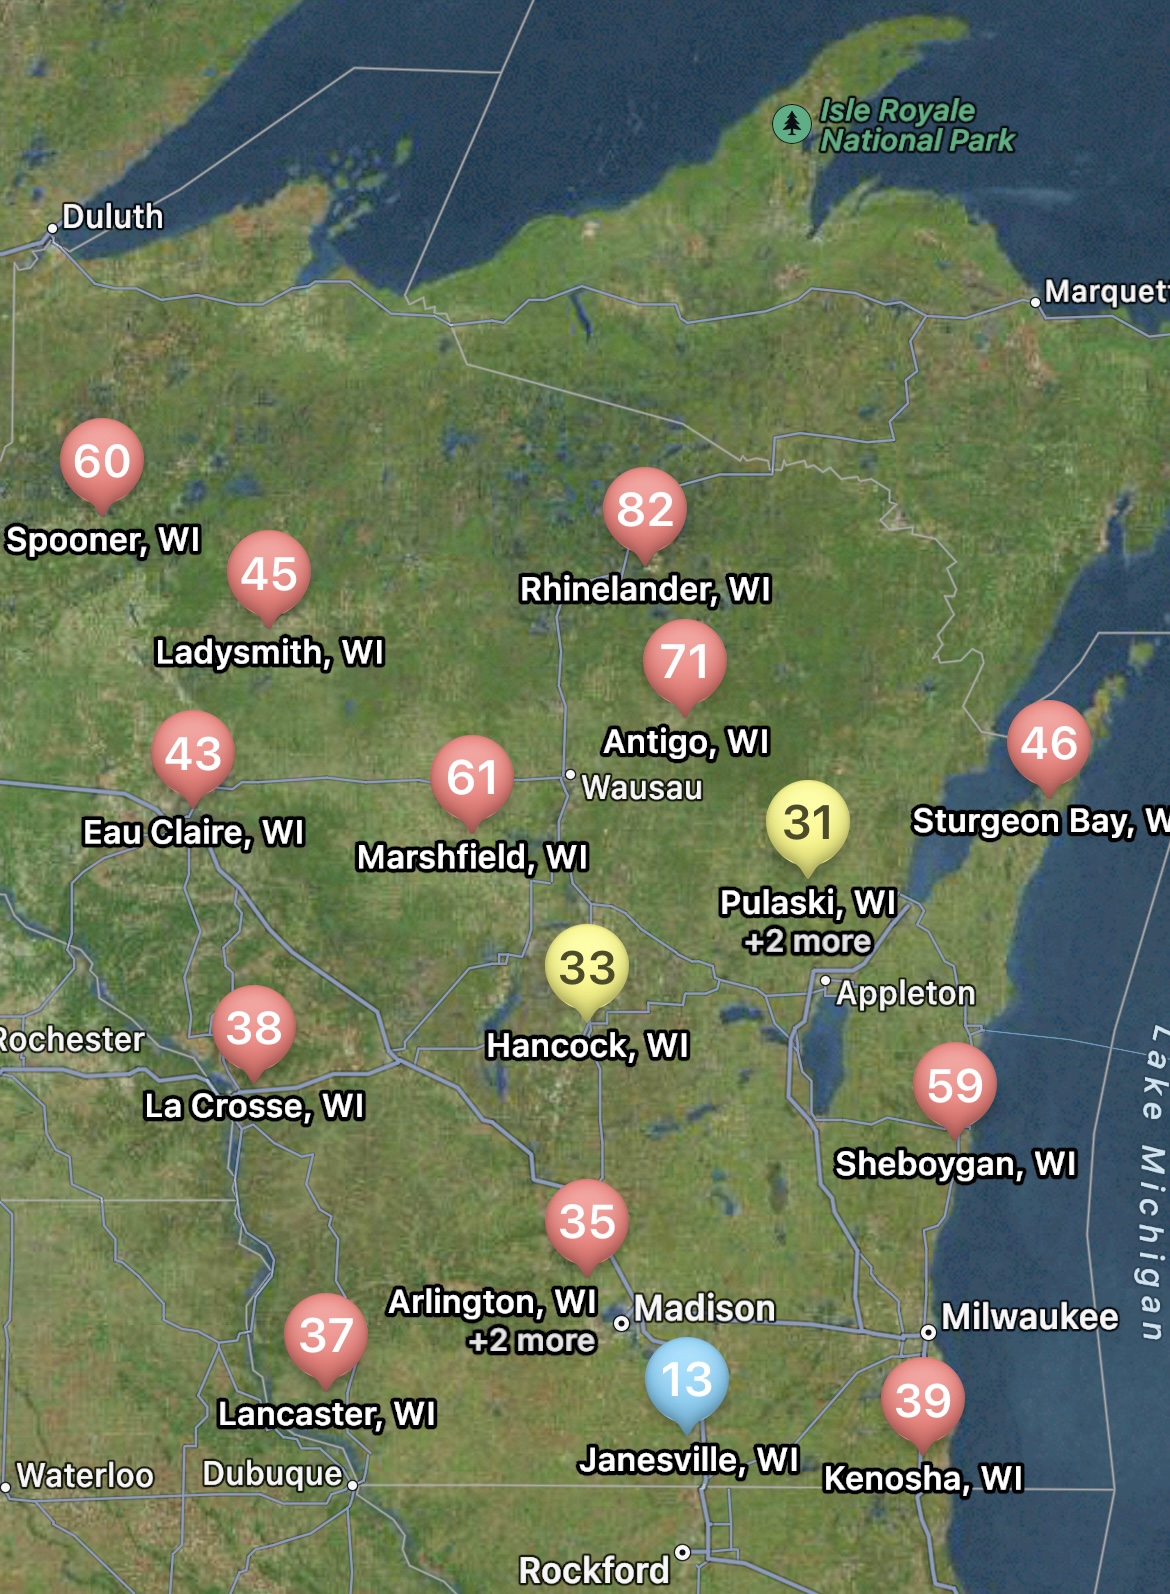
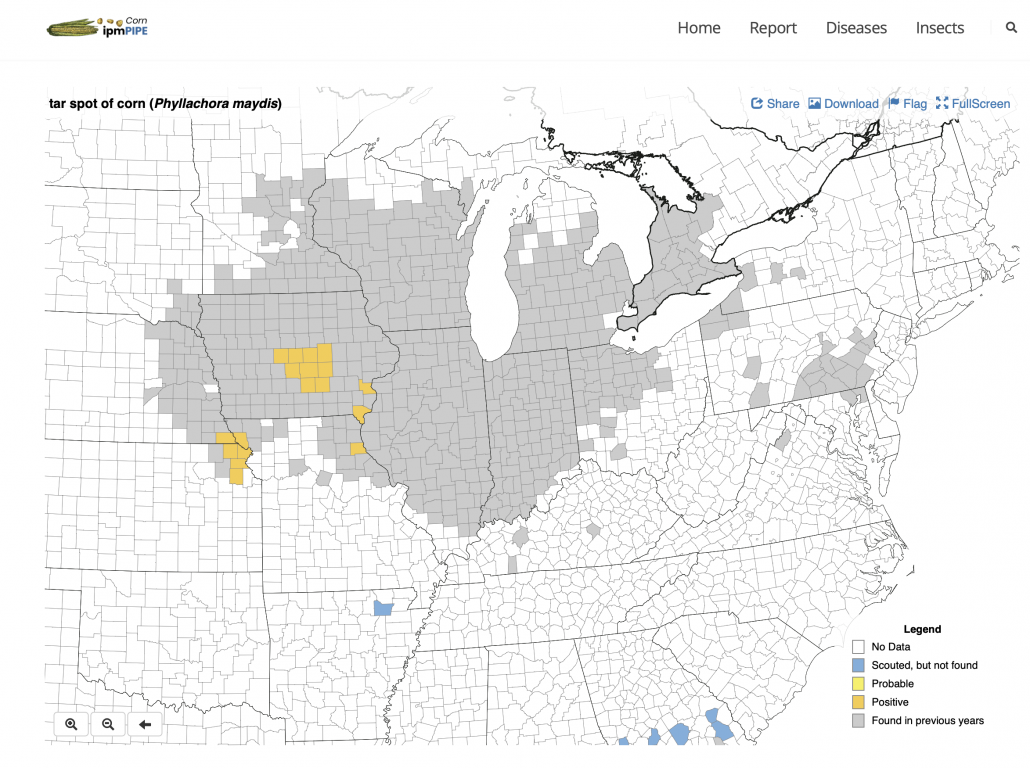
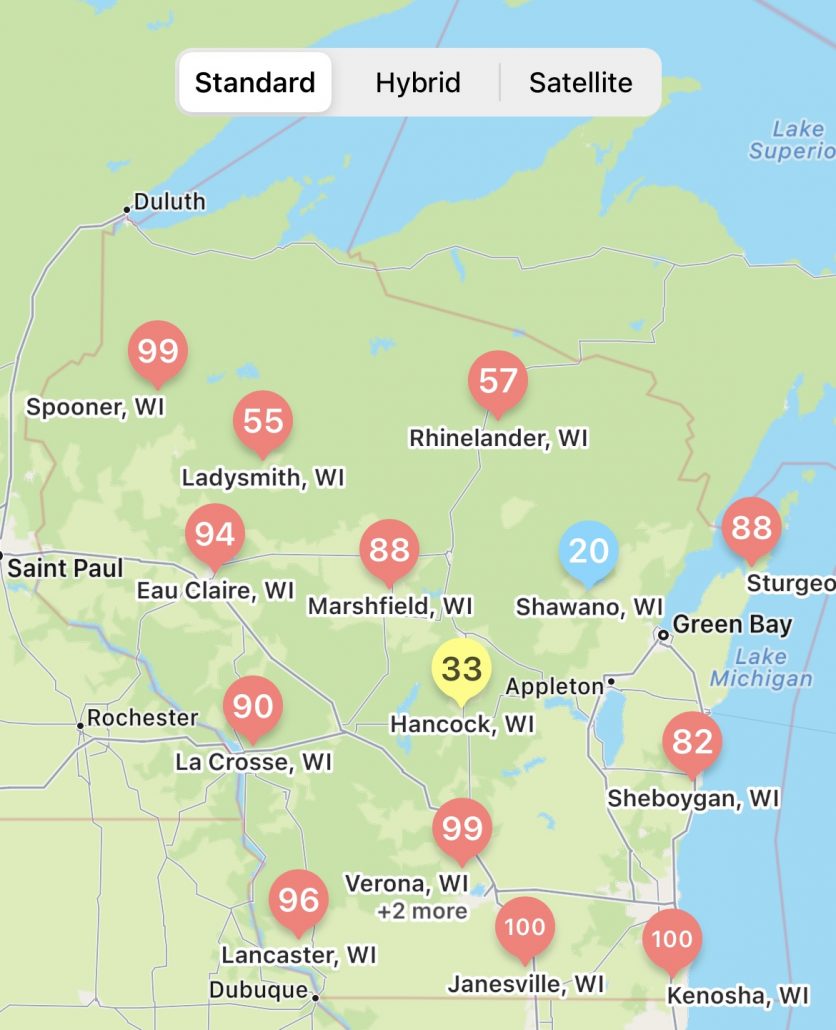
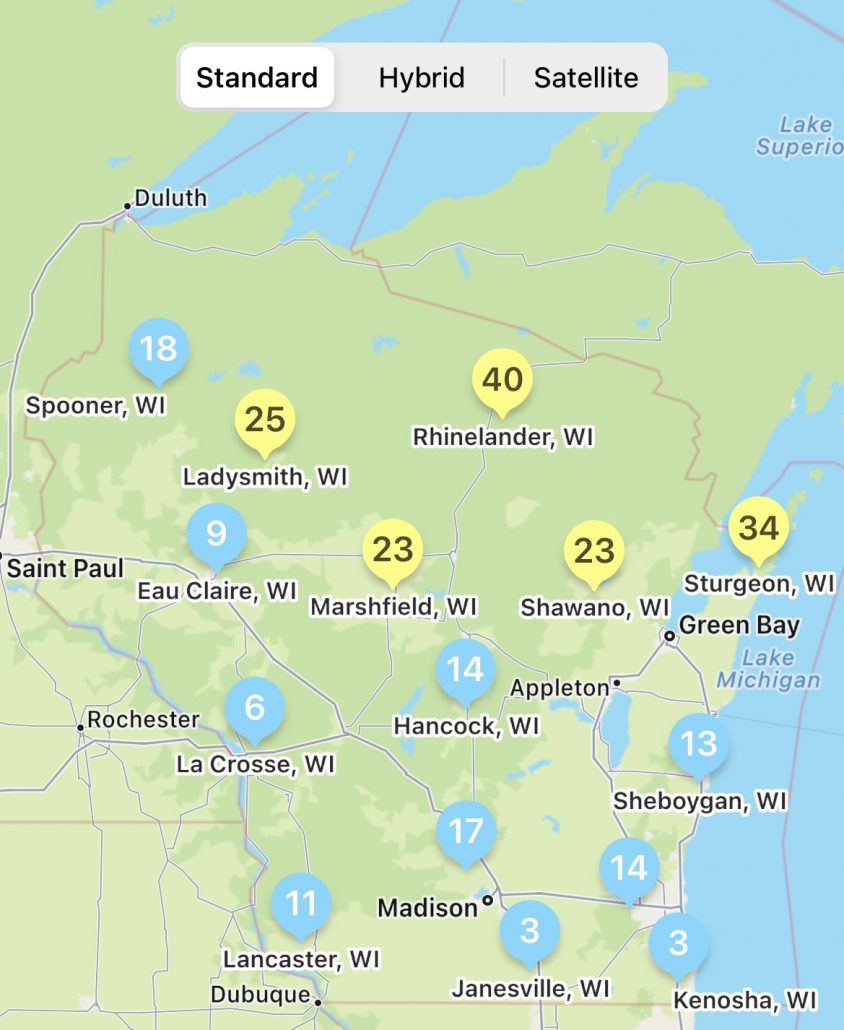
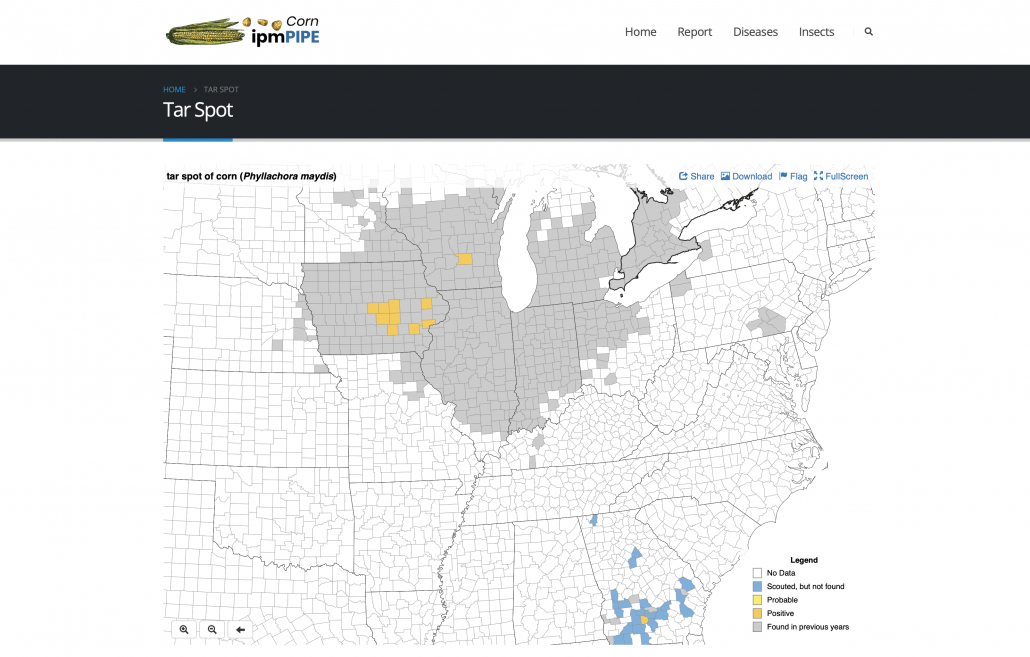
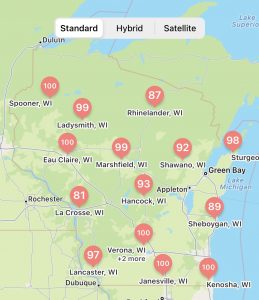
Tar spot of corn has been an issue on silage corn in Wisconsin since 2016. In fact, the first finding of tar spot was on corn for silage that year. Since 2016 the largest and most consistent impacts happen on corn for silage vs. corn for grain. Yes, tar spot can result in significant grain losses, but tar spot can also affect the overall plant in other ways such as loss in dry-matter yield (Fig. 1) and whole plant moisture contents well below optimal, making bunker-packing a significant issue. In recent work in Wisconsin, we see significant dry-matter yield reductions when tar spot severity on the ear leaf reaches over 10% at the time of chopping. This can result in as much as 15% reduction in yield, with these impacts dramatically increasing at severity levels of 20% or more on the ear leaf (Fig. 1). If tar spot (or any foliar disease) is moving quickly in your silage crop, you might consider chopping a bit earlier to reduce dry-matter yield losses and to try to optimize whole plant moisture, prioritizing good bunker management. If moisture at chopping is not prioritized, then subsequent storage issues such as mold and mycotoxin concerns can arise indirectly, due to poor bunker management. This brings us to Gibberella ear and stalk rot in silage corn.

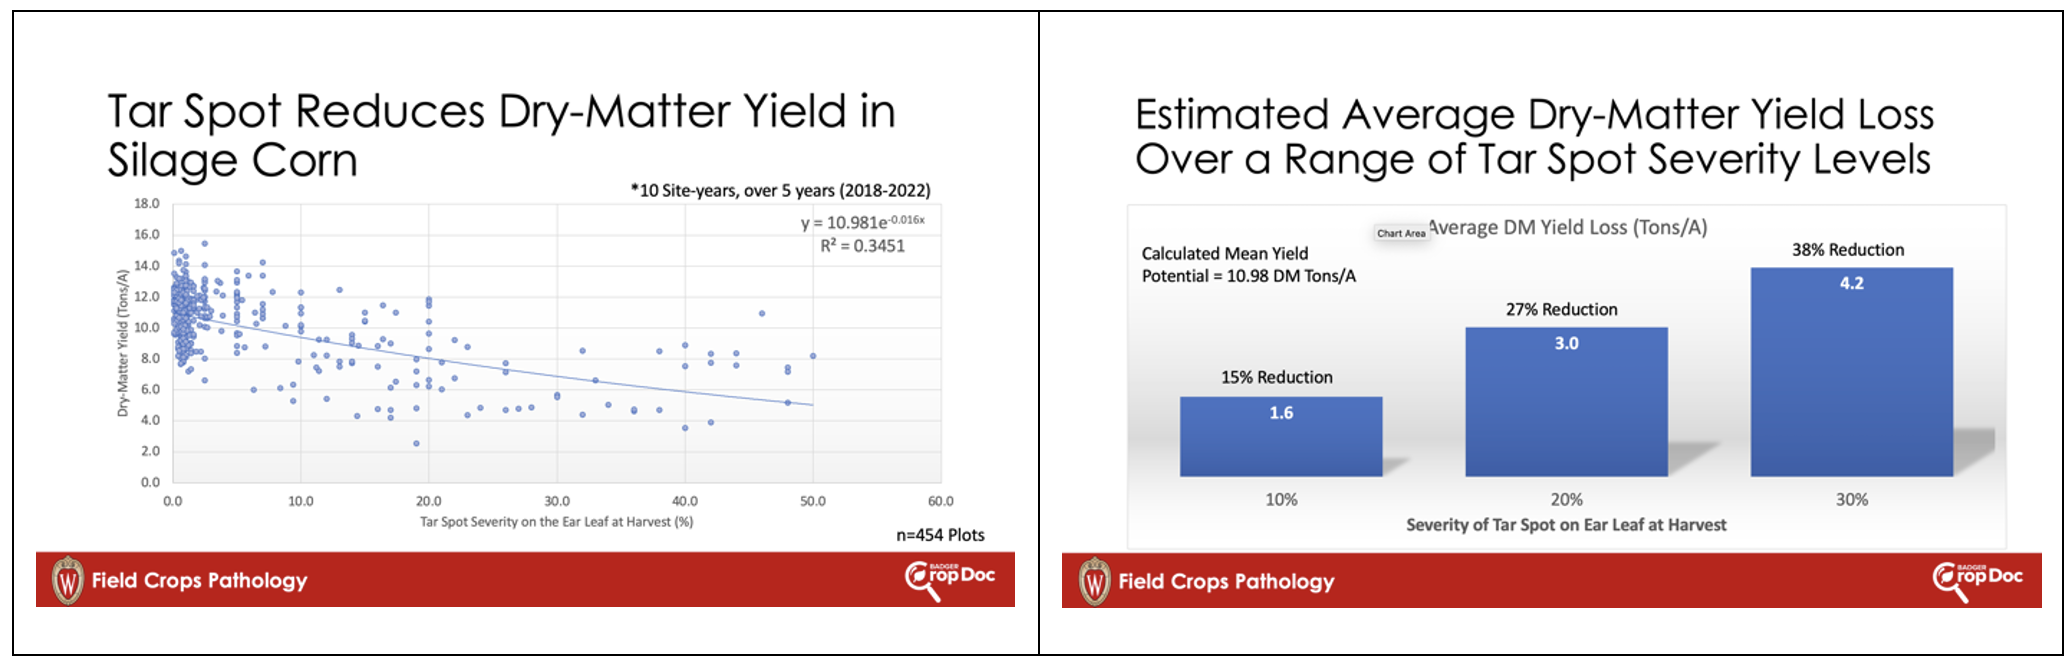
Figure 1. Impact of tar spot severity on the ear leaf at harvest time compared to dry-matter yield in whole-plant chopped silage corn.

Gibberella and silage harvest

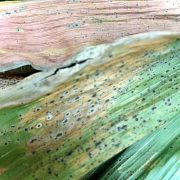
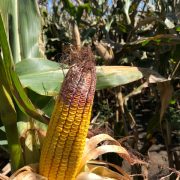
Gibberella ear rot is caused by Fusarium graminearum (a.k.a. Gibberella zea). The same pathogen can cause Gibberella crown and stalk rot in corn. We have observed both diseases on silage corn in Wisconsin in recent years. Our environment here in the Great Lakes region makes a perfect place for this pathogen to cause these diseases. In addition to the damage that the pathogen can cause, the fungus can also produce various mycotoxins, most importantly deoxynivalenol (DON or Vomitoxin). Our laboratory has conducted quite a bit of research recently trying to understand where in the plant DON accumulates. In detached plant part experiments, we have noted that DON can accumulate in both the stalk and ear portions of the plant, AND that these two phases of accumulation are not linked to each other (Chibuogwu et al., 2024). The fungus can infect these parts separately at different times during the season and the subsequent accumulation of DON can happen differentially in the stalks vs. the ears. This is partially why you can go out to the field and scout for ear rot and not see a lot of infection (moldy ears), but still have high DON levels at chopping time. Some of that DON is likely accumulating in the stalks.

We have also been following the fate of DON in silage harvested and chopped from a brown midrib (BMR) hybrid and a dual-purpose hybrid that were grown in the field and treated with fungicides at white silk (R1). We chopped the plants in each plot and then used mini-silos (polyethylene bags vacuum-sealed using a commercial grade vacuum packer) to conduct a time-course experiment following DON levels in the mini-silos (Chibuogwu et al. 2025). In all cases we saw DON levels generally increasing in the first 30 days after chopping (Fig. 2). They then leveled off and became stable at 60, 90, and 120 days after chopping. Some of this increase could be due to oxygen still in the system during the first 30 days after chopping. DON-producing fungi are aerobic and continue to consume some of the minute levels of oxygen still in the system, thereby still producing DON. However, this likely only explains some of the DON levels we detected.

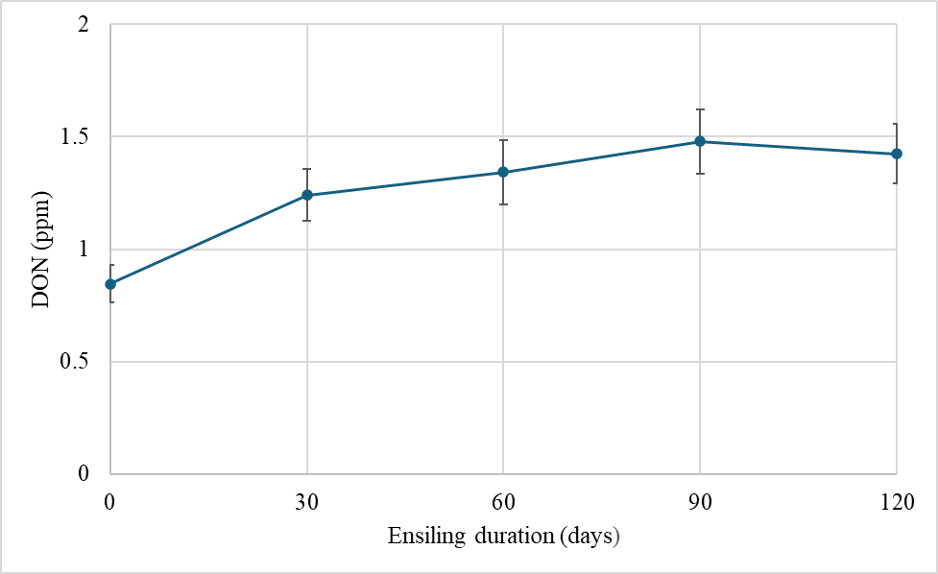
Figure 2. DON concentration of chopped field-grown silage corn over time of ensiling.

There are also “masked” or conjugated forms of DON that are detectable in routine DON analyses. One such conjugate is DON-3-glucoside (D3G). D3G can be produced by fungi or during a plant’s attempt to protect itself from the toxicity of DON. Either way, D3G is not detectable in routine test and must be tested for specifically. We investigated our samples further during the first 30 days of ensiling and found that the level of D3G at harvest, explained a significant level of the DON recorded in samples after 30 days of ensiling. This is to say that D3G present at harvest, is likely metabolized in the first 30 days of ensiling releasing DON and resulting in higher DON levels 30-days later (Fig 3). Again, this relationship only partially explains why DON increases in silage during the first 30 days of storage. The full explanation is likely due to both metabolization of D3G and continued fungal respiration leading to an increase in DON at feed out compared to when it was packed in the bunker.

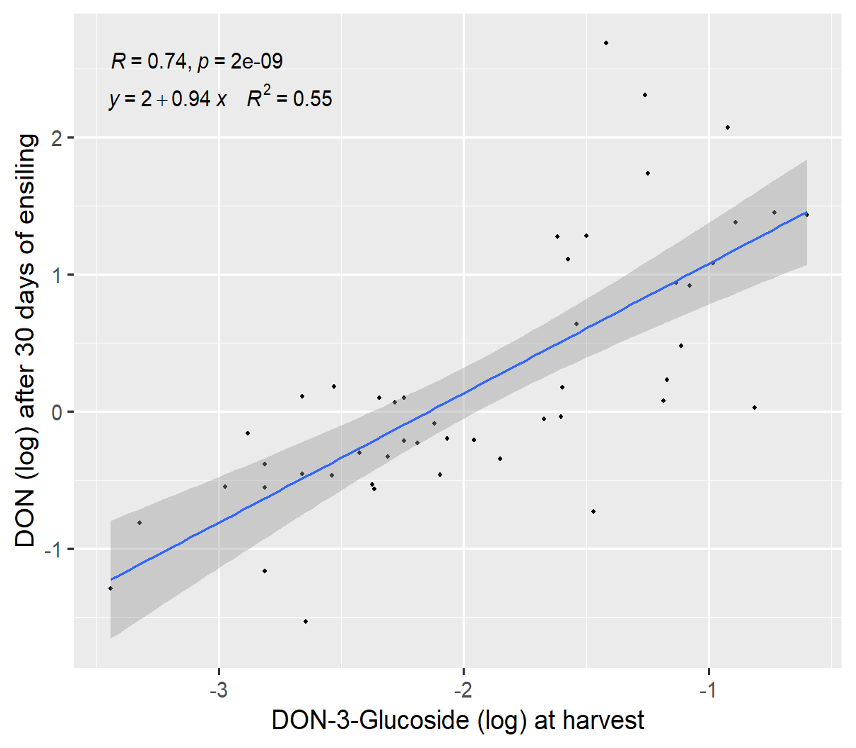
Figure 3. Relationship of DON-3-Glucoside (log) at harvest and DON concentration after 30 days of ensiling.

The Take Home

So, what are we to do with all of this information? Well, knowledge is power. You need to balance foliar disease management with Gibberella/DON management when making high-quality silage in Wisconsin. Diseases like tar spot are the new normal. As you prepare to harvest, it is a good idea to get out in the field and see how bad the foliar disease is and how much ear rot you are seeing. You will want to prioritize harvest on fields showing more disease. In fields where there are high levels of tar spot, southern rust, or NCLB, monitor moisture carefully and try to chop to optimize moisture. Concentrate on good bunker hygiene and spend time packing the material as best you can, focusing on getting as much oxygen out of the system as you can. If a corn crop becomes too dry to make good silage, you might consider harvesting it for high-moisture grain to try to circumvent bigger issues that could arise at feed out, by making less than ideal silage. Finally, it is important to test for DON frequently and understand what you are dealing with. You want to start with the lowest levels of DON coming from the field that you can. DON will likely increase in the bunker no matter how well you pack it. Thus, starting with the lowest levels at harvest will help keep final levels of DON below critical thresholds. Moving forward, mycotoxin testing in corn should include not only DON but also for conjugates of DON that can be metabolized back to DON and increase the final DON concentration during ensiling.

Have a safe and productive silage harvest season!

Citations

Chibuogwu, M.O., Groves, C.L., Mueller, B., and Smith, D.L. 2024. Effects of fungicide application and corn hybrid class on the presence of Fusarium graminearum and the concentration of deoxynivalenol in ear and stalk parts of corn (Zea mays) used for silage. Plant Disease. https://doi.org/10.1094/PDIS-12-23-2662-RE.

Chibuogwu, M.O., Reed, H., Groves, C.L., Mueller, B., Barrett-Wilt, G., Webster, R.W., Goeser, J., and Smith, D.L. 2025. Influence of hybrid class and ensiling duration on deoxynivalenol accumulation and its derivative deoxynivalenol-3-glucoside while ensiling corn for silage. Plant Disease. https://doi.org/10.1094/PDIS-06-24-1166-RE.

Wisconsin Field Crop Disease Update – August 10, 2024

Damon Smith, Extension Field Crops Pathologist, Department of Plant Pathology, University of Wisconsin-Madison

Tar Spot of Corn

Figure 1. Statewide tar spot risk as calculated by the Field Prophet tool for August 10, 2024.

You can find the most recent updates on tar spot confirmations across the U.S. here: https://corn.ipmpipe.org/tarspot/. The Field Prophet tool is also showing mostly moderate risk across the southern two-thirds of Wisconsin, with just the northern tier with high risk for tar spot development at this point in the season (Fig. 1). This means that the weather is less conducive for tar spot development and spread. We are also quickly approaching the end of the in-season management window for applying fungicides in corn for tar spot control. For the major foliar diseases of corn, including tar spot, the optimal window to apply fungicides and maximize return on investment, is between the VT/R1 and R3 growth stages. If your crop has reached the milk growth stage and you are still not seeing any disease and the Tarspotter risk isn’t high, you can hold off on the fungicide application. The likelihood of a yield-limiting tar spot epidemic is low in this situation. You can learn more about fungicide application for tar spot control here.

White Mold of Soybeans

Figure 2. Statewide white mold risk as calculated by the Field Prophet tool for August 10, 2024.

The risk for white mold according to Field Prophet is a bit higher compared to tar spot. Risk is generally high across the state with several pockets of low or medium risk. This means that weather has been conducive for the development of the mushroom-like structure (apothecia) of the white mold fungus that gives rise to spores that infect soybean. These risk estimates appear to be accurate as we continue to find apothecia in fields with a history of white mold (Figure 3). With that said, the soybean crop is quickly approaching the R4 growth stage or beyond, where the opportunity of infection by the white mold fungus does not exist. Thus, there is not a need to spray for white mold beyond the R4 growth stage. Similar to tar spot, the optimal timing of fungicide application ranges from the R1 growth stage to the R3 growth stage in soybeans. If you no longer see flowers on soybeans, then the risk for infection by the white mold fungus is low, despite conducive weather for the fungus.

Use Predictive Tools like a “Crystal Ball”

We continue to get questions about how the apps (Tarspotter, Sporecaster, and Field Prophet) should be used to make decisions about in-season disease management. We have designed these tools to be predictive. This means that the risk indexes you see are telling you that in the next week or two, you might see these diseases pop up. We developed these tools to act like a “crystal ball” so that you can look ahead and apply fungicides in a preventative manner. We know that fungicides work best when applied preventatively. In addition for diseases like tar spot, the fungus that causes this disease has a very long incubation period (time from infection to when you actually see tar spots). This time period can be as long as 30 days. So a high risk today, might indicate seeing tar spot show up even a month from now. Be sure to use these tools to look into the future and to prepare yourself, rather than being reactionary.

Figure 3. Apothecia of the white mold fungus at the base of a soybean stem.

Other Diseases to Watch

Figure 4: Northern corn leaf blight (NCLB) lesion on a corn leaf.

We are starting to find more and more northern corn leaf blight (NCLB; Figure 4) in some fields in Wisconsin. This makes sense as the weather recently has been cooler and wetter. Luckily most of the fungicides used for tar spot also have good efficacy against NCLB. Thus if you sprayed for tar spot, you have probably controlled NCLB too. For those with silage corn, especially brown mid-rib (BMR) hybrids, continue to scout your fields for NCLB. Some BMR hybrids are very susceptible to this disease. If NCLB begins to move quickly and you are approaching your harvest window, you might consider chopping a bit earlier in order to reduce damage by NCLB.

We also continue to watch the frogeye leaf spot situation in soybeans. Our beta-testing models for frogeye leaf spot have shown relatively low risk for this disease in Wisconsin this season. We also have not found any frogeye leaf spot to date. However, the risk is creeping up in southern Wisconsin. The window to treat for this disease ends around R5. Thus, I believe most of the soybeans in Wisconsin will escape frogeye leaf spot without the need to apply a fungicide this season. However, keep an eye on your fields and continue to scout to stay informed of the situation.

Mid-Season Corn and Soybean Disease Update and New Corn Fungicide ROI Calculator

Damon Smith, Extension Field Crops Pathologist, Department of Plant Pathology, University of Wisconsin-Madison

Tar Spot and Corn

Figure 1. Statewide tar spot risk as calculated by the Field Prophet tool for July 22, 2024.

You can find the most recent updates on tar spot confirmations across the U.S. here: https://corn.ipmpipe.org/tarspot/. The Field Prophet tool is also showing mostly moderate to high risk across the state of Wisconsin (Fig. 1). This means that if your crop is between VT/R1 and R3 you should be actively scouting for tar spot and making the decision to apply a fungicide at this time. Our research has shown that one well-timed application of fungicide somewhere between VT/R1 – R3 will control tar spot enough for a yield response even in a heavy-pressure year. You can learn more about managing tar spot BY CLICKING HERE. If you think you found tar spot I would appreciate if you would let us know. We can enter the county level data into the Corn IPMPipe Map and contribute to the cause.

Gray Leaf Spot and Corn

We are also watching the gray leaf spot (GLS) situation closely. The southern and southwestern portions of the state have had enough heat and moisture that risk is likely high for this disease in those locations. For the rest of the state, risk isn’t as high, but likely moderate risk exists. Fortunately, the same fungicides that work well in controlling tar spot, also work well against GLS. Thus, another reason that a fungicide application may need to be considered at this point in the season.

Corn Fungicide ROI Calculator

With the tight margins in the corn market, and a high risk for disease due to wet weather, I have been getting a lot of questions about fungicide return on investment (ROI) this season. Fortunately, the scientists involved in the Crop Protection Network have been working on amassing fungicide performance and ROI data over the last few seasons and have launched a new interactive Fungicide ROI tool. The tool is research-based using data from across the entire U.S. corn production belt, including Wisconsin. During the studies included in this dataset, the diseases of interest were tar spot and also southern rust. Both are again diseases of interest this season. The tool can be used to run various scenarios that fit your farm and situation in the 2024 growing season. You can change the expected end-of-season disease severity levels, and the pricing of products included in the tool. Not all products labeled for corn can be found there, but most of the popular ones are included. You can also adjust the sale price for your crop, and expected farm yield, so that you can get real estimates of ROI and probability of breaking even for your situation. An example scenario can be found in figure 2 where I adjusted the tool to 180 bu/a yield and a corn sale price of $4 per bushel with expected high levels of tar spot or southern rust. You can see that several products result in a positive net benefit per acre using default product pricing. However, the tight margins this year, do result in lower breakeven probabilities. I would suggest running the tool for your situation. Be honest with yourself and put real numbers in the tool. This tool may be helpful for you if you are on the fence about spraying a fungicide this year. If you have a known resistant hybrid, your crop is already through to R3, and no disease has shown up yet, you might be able to help your financial situation by not spraying this season.

White Mold and Soybeans

Figure 3. Statewide white mold risk as calculated by the Field Prophet tool for July 22, 2024.

The risk for white mold according to Field Prophet is a bit spottier compared to tar spot. Mostly the northern and central portions of the state are at high risk with some pockets of moderate risk. The southeastern portion of Wisconsin is at low risk currently (Fig. 3). This is due to hotter temperatures several weeks back. Regardless of location, our models are telling us that the risk for white mold will continue to rise across the state over the next 7 to 10 days. If you are in a low-risk area and you are at R3 or beyond, you might not have much to worry about for this year when it comes to white mold. However, if you are in a moderate-risk zone, watch this situation carefully. If you are at R3 and the crop has good canopy, you might consider one late R3 application. If you are in a high-risk zone, the crop has canopied, and your soybean crop is in the bloom period, it is time to think about a fungicide application. These will be the areas I would expect to find white mold 1-3 weeks from now. If you would like to learn more about white mold management, check out my previous article HERE.

As always, get out and look at the crop. Scout, scout, scout!

Whoomp! There it is! What to do about Tar Spot of Corn in 2024

Damon Smith, Extension Field Crops Pathologist, Department of Plant Pathology, University of Wisconsin-Madison

Over the last several weeks we have seen confirmed positives for tar spot in parts of Iowa, Missouri, Kansas, Nebraska, Indiana, Illinois, Michigan, and now Wisconsin (Pepin Co.; Fig. 1). While it has been found in Wisconsin, the severity and incidence are extremely low and does not necessitate spraying fungicide at the moment! So, what should we do now?

My advice is to get prepared and make sure you have the tools in place to deal with this problem. As I said the last few seasons, tar spot is here to stay and we need to simply be prepared and ready to fight the disease. The first line of defense is to know if you have had tar spot before. This will tell you if there is resident inoculum sources present that can initiate epidemics. If you have seen tar spot on your farm before, then assume the pathogen is present and in close proximity to corn (the host). Remember the disease triangle? The last component of the triangle is the weather. If there has been conducive weather then the triangle has been met and risk is high for finding tar spot. So how do you know if the weather is conducive? Well, there is an app for that!

Tarspotter and Field Prophet are both Smartphone applications that can help you determine if the weather has been conducive to put your corn crop at high risk of tar spot development. The app DOES NOT tell you if the pathogen is present. We are working on this part of the triangle to improve our predictions, but you need to determine if the pathogen is present in your field. This tool just tells you if the weather has been conducive.

So what weather is conducive for tar spot development? Yes, precipitation is helpful, but more importantly, we need intermittent wet/dry cycles to give us intermittent leaf wetness. Specifically leaf wetness at night. What gives leaf wetness this time of year other than rain? That would be high dew points and humidity. These variables are included in the models that run in Tarspotter and Field Prophet. We also include temperature which is an influential variable too. These variables are measured over the last 14 days and 30 days and included in each daily run of the tool. We use the GPS on the smartphone to pull down cloud-based weather for a precise location. Thus, these results are site-specific. I also like to the use the Field Prophet version of the models as this version provides a 7-day trend line on how weather has been progressing and also allows for a true 7-day forecast. These additional tools can better help with the decision-making process. If you would like to learn more about the “nuts and bolts” that run behind the smartphone apps, you can find our research publication HERE.

My corn is at V8-V10, should I spray Fungicide?

Figure 2. Tar spot severity diagram indicating various levels of tar spot on corn leaves. Yield loss isn’t typically detectable in the field until severity reaches 10% or more on the ear leaf or leaves above this leaf.

My short answer is no! The disease is just getting started. If you find it in Wisconsin right now, it will be at low severity and is low in the canopy on leaves that are not going to contribute to yield. My advice is to use your prior knowledge of where tar spot occurred and the Tarspotter tool to help guide your scouting efforts. Get out into the fields and know what you are dealing with. Figure 2 shows various severity levels on a corn leaf. We don’t start to see yield loss until we reach about 10% severity on the ear leaves or above. Thus, you have time! Target fields planted to known susceptible hybrids. Get yourself prepared and use those lower leaves to monitor severity and tar spot progress. Be ready to protect (put fungicide on) those leaves that contribute to yield (ear leaf and above), later on especially if the weather becomes increasingly conducive (think wet/dry cycles!) and/or your scouting indicates severity is increasing.

When should I spray fungicide? What should I use?

When making decisions on using a fungicide for tar spot management keep in mind that fungicide active ingredients are important. Products with multiple fungicide classes are preferred (QoI + DMI or QoI + DMI + SDHI). Products with multiple fungicide classes tend to provide better efficacy and delay the development of fungicide resistance. See the CPN Fungicide Efficacy Guide for specific products and their ratings for tar spot and other diseases.

Application timing is very important for tar spot management. It is best to use scouting and/or tar spot risk or profit tools like Tarspotter and Field Prophet to make informed decisions about when to apply fungicides for tar spot management. These apps use weather data to determine if the environmental conditions are favorable for tar spot to develop, and consequently optimize fungicide application timing.

In most years, a fungicide application will not be needed prior to the V10 growth stage. In most years, one well-timed (VT-R3 growth stages) fungicide will be sufficient to manage tar spot. Even in years where two applications appear to improve tar spot control, improved ROI is marginal over a single well-timed application.

The Conclusion

DON’T PANIC! This is just a call to be ready. Download the apps and know what the weather is doing. Use your prior knowledge and scouting in key locations to track tar spot. Get your management plan in place. Have your fungicide of choice available. Communicate with your custom applicator. Be ready to spray between the VT and R3 growth stages if you plan to use just one fungicide application and you are seeing tar spot increase. If you spray between the V8 and VT growth stages, be ready to monitor the smartphone apps and do more scouting as you might have to pull the trigger again later in the season. Get out and SCOUT, SCOUT, SCOUT!

Other Resources

Wisconsin Field Crops Disease Update, August 9, 2023

Damon Smith, Extension Field Crops Pathologist, Department of Plant Pathology, University of Wisconsin-Madison

Figure 1. A Screen shot of a map developed in the Field Prophet app showing risk for tar spot development in Wisconsin as of August 9, 2023.

Well, it was going to happen sometime soon, tar spot has been confirmed in two counties in Wisconsin. You can track tar spot confirmations in realtime HERE. Both Lafayette and Rock counties were confirmed to have low levels of tar spot in several fields this week. The good news is that these finds are a month behind the initial confirmations in the state for the last two seasons. What does this mean? Well, it means that the tar spot impact on grain yield will likely not be has significant as it has been over the last couple of seasons. Exceptions to this statement will include late-planted corn where the current growth stages are around VT (tasseling) and susceptible silage hybrids. You should scout and track these situations carefully. Be prepared to chop silage early if tar spot really starts to move. You will want to watch moisture carefully in these situations.

The current risk for tar spot development remains moderate to high across much of the state (Fig. 1). Cooler weather and dewy evenings and mornings are keeping the risk elevated. Fungicide applications for much of the corn in the state should have happened already. Remember the optimal time to apply fungicides to control tar spot (and most other foliar corn diseases) is between the VT (tasseling) and R3 (milk) growth stages. Spraying fungicide after R3 has not yielded much of a return on investment. If you find tar spot, please don’t hesitate to send a high-quality photo to damon.smith@wisc.edu. We don’t disclose exact locations, but do like to track the county-level tar spot information. If you would like to learn more about tar spot and managing it, see my previous post HERE.

Figure 2. Sporecaster predictions for selected non-irrigated locations in Wisconsin for August 9, 2023.

In other news, white mold risk ranges from low in the southern portion of the state to moderate and high in the mid and upper portions of the state, respectively (Fig. 2). Most soybeans are probably headed toward the R4 or R5 growth stage. This means fungicide applications will no longer yield positive returns on investment. If soybeans were planted late and they are still in the R1 to R3 growth stages and you are in a moderate to high risk area, a fungicide should be applied at this time. If you would like to learn more about white mold management, see my previous post HERE. We have observed active white mold on susceptible varieties under irrigation already this season. I am anticipating pockets of white mold in the state, especially in our typical areas of concern in the central and northeastern quadrants.

As always, make sure you are out and scouting to be prepared for what is coming ahead!

Wisconsin Field Crops Disease Update, July 27, 2023

Damon Smith, Extension Field Crops Pathologist, Department of Plant Pathology, University of Wisconsin-Madison

Shawn Conley, Extension Soybean and Small Grains Agronomist, Department of Plant and Agroecosystem Sciences, University of Wisconsin-Madison

Rains continue to fall around Wisconsin. While we still have a moderate drought in much of the state, some of that drought is being alleviated. However, with these timely rains, come disease concerns. Here are our thoughts on what is happening.

Phytophthora Root and Stem Rot of Soybean

Figure 1. Stem rot symptoms of Phythophthora rot and stem rot on soybeans.

It has been a couple of years since we have seen a significant epidemic of Phytophthora root and stem rot (PRSR) of soybean. However, since it has started raining, we have got a good look at how susceptible many of our soybean varieties are here in Wisconsin. PRSR is primarily cause by the fungal-like organism, Phytophthora sojae. PRSR is usually worse in fields that are no-till and/or are slow to drain. The PRSR pathogen likes to survive in old soybean residue and can also persist as a long-term survival structure in the soil itself. The organisms that causes PRSR becomes active if the soil temperatures are over 60 F and the soil becomes saturated. We had those conditions occur back in early to mid-July. Once the soil dried out a bit and a bit of environmental stress kicked in, we can readily observe the damage the organism caused in early July. Primarily what we are seeing right now is the stem rot phase (Fig. 1), with the symptoms including wilting of the plant and a distinct purple-brown lesion extending from the soil surface upward. If plants are pulled from the ground, you will also see poor root systems which is where the organisms typically first infects and causes damage.

At this point in the season, there is nothing that can be done.  DO NOT spray foliar fungicides for this problem. This will not be effective. You will want to check on the variety with the symptoms and consult the tech sheet to see what type of “Phytophthora gene” may have been included in the variety. These genes are called Rps genes and provide race-level resistance. The population of the PRSR pathogen can be a single race or mixed races in the field. The last time a survey of Phytophthora races was done in Wisconsin, it was noted that the Rps 1-k resistance gene should be effective on about 99% of the acres in the state. However, that survey was done over 15 years ago. Due to heavy use of the Rps 1-k resistance gene, we believe that the population in the state has shifted. We are seeing that resistance readily overcome. Unfortunately, most of the varieties currently grown in the state have this resistance. A recent check of the soybean variety trials 2022 show that out of 265 varieties tested 25% had no PRSR resistance gene, 2% had Rps 1-a, 29% Rps 1-c, 26% Rps 1-k, 9% Rps 3-a, and 9% had multi-genes. We are actively working with the Wisconsin Soybean Marketing Board to understand what the current population looks like. However, it is too early to tell what the races are primarily in our fields. Moving forward. perhaps choosing Rps 3-a or mixed gene varieties could help, but that is a shot in the dark for now.

Other things you can do for PRSR are to open up the rotation between soybean crops, and improve drainage in fields that are typically saturated for long periods of time. Like I said above, adjusting variety choice can help too. Seed treatment fungicides can also be used. However remember that the seed treatment is only going to be effective for the first 30 days or so after planting. After that we have to rely on varietal resistance to manage this problem. If you would like to find efficacy data on the seed treatments you can find that HERE.

We are looking for samples of PRSR from around Wisconsin. So feel free to reach out (damon.smith@wisc.edu) and we can coordinate getting samples sent to us. This will help with our survey efforts and eventual varietal recommendations.

Tar Spot Update

Figure 2. A Screen shot of a map developed in the Field Prophet app showing risk for tar spot development in Wisconsin as of July 27, 2023.

You can find the most recent updates on tar spot confirmations across the U.S. here: https://corn.ipmpipe.org/tarspot/.  Tarspotter is also showing mostly moderate to high risk across the state of Wisconsin (Fig. 2). This means you should be actively scouting for tar spot at this time. The risk is likely that you will find it across much of the state. If the corn growth stage is between VT/R1 and R3, then you might go ahead and consider a fungicide application. Our research has shown that one well-timed application of fungicide somewhere between VT/R1 – R3 will control tar spot enough for a yield response even in a heavy-pressure year. You can learn more about managing tar spot by clicking here. If you think you found tar spot I would appreciate if you would let us know. We can enter the county level data into the Corn IPMPipe Map and contribute to the cause.

White Mold Update

Figure 3. Sporecaster predictions for selected non-irrigated locations in Wisconsin for July 27, 2023.

The risk for white mold according to Sporecaster is a bit more spotty, compared to tar spot. Mostly the northern tier of the state is at high risk while central and southern Wisconsin varies from moderate to low (Fig. 3). If you are in a low-risk area and you are at R3 or beyond, you might not have much to worry about for this year when it comes to white mold. However, if you are in a moderate-risk zone, watch this situation carefully. If you are at R3 and the crop has good canopy, you might consider one late R3 application. If you are in a high-risk zone, the crop has canopied, and your soybean crop is in the bloom period, it is time to think about a fungicide application. The recent rains have made the risk in these areas generally stay high or increase. These will be the areas I would expect to find white mold 1-3 weeks from now. If you would like to learn more about white mold management, check out my previous article HERE.

As always, get out and look the crop. Scout, scout, scout!

What Should I do About Tar Spot of Corn in 2023?

Damon Smith, Extension Field Crops Pathologist, Department of Plant Pathology, University of Wisconsin-Madison

Brian Mueller, Researcher II, Department of Plant Pathology, University of Wisconsin-Madison

Roger Schmidt, Nutrient and Pest Management Program, University of Wisconsin-Madison

It didn’t take long this year to find tar spot in the Midwest. Over the last several weeks we have seen confirmed positives for tar spot in parts of Iowa, Missouri, Kansas, and Nebraska (Fig. 1). This is earlier than last year despite. With that said, the severity is extremely low and does not necessitate spraying fungicide at the moment! So what should you do?

Figure 1. Map of U.S. counties where tar spot has been confirmed in the 2023 season, as of July 5, 2023. Map source: https://corn.ipmpipe.org/tarspot/.

What should I do?

My advice is to get prepared and make sure you have the tools in place to deal with this problem. As I said the last few seasons, tar spot is here to stay and we need to simply be prepared and ready to fight the disease. The first line of defense is to know if you have had tar spot before. This will tell you if there is resident inoculum sources present that can initiate epidemics. If you have seen tar spot on your farm before, then assume the pathogen is present and in close proximity to corn (the host). Remember the disease triangle? The last component of the triangle is the weather. If there has been conducive weather then the triangle has been met and risk is high for finding tar spots. So how do you know if the weather is conducive? Well, there is an app for that!

Tarspotter and Field Prophet are both Smartphone applications that can help you determine if the weather has been conducive to put your corn crop at high risk of tar spot development. Figure 2 shows a map of Wisconsin from the Field Prophet version of the tool that is showing that weather has been highly conducive for the development of tar spots. The app DOES NOT tell you if the pathogen is present. We are working on this part of the triangle to improve our predictions, but you need to determine if the pathogen is present in your field. This tool just tells you if the weather has been conducive.

Figure 2. A Screen shot of a map developed in the Field Prophet app showing risk for tar spot development in Wisconsin as of July 5, 2023.

So what weather is conducive for tar spot development? You are probably asking yourself this as we are in an epic drought, yet the forecasted risk of tar spot is high across the state. Well conducive weather for the pathogen it is different that the weather needed to grow corn. Yes, precipitation is helpful, but more importantly, we need intermittent wet/dry cycles to give us intermittent leaf wetness. Specifically leaf wetness at night. What gives leaf wetness this time of year other than rain? That would be high dew points and humidity. These variables are included in the models that run in Tarspotter and Field Prophet. We also include temperature which is an influential variable too. These variables are measured over the last 14 days and 30 days and included in each daily run of the tool. We use the GPS on the smartphone to pull down cloud-based weather for a precise location. Thus, these results are site-specific. I also like to the use the Field Prophet version of the models as this version provides a 7-day trend line on how weather has been progressing and also allows for a true 7-day forecast. These additional tools can better help with the decision-making process. If you would like to learn more about the “nuts and bolts” that run behind the smartphone apps, you can find our research publication HERE.

My corn is at V10, should I spray Fungicide?

My short answer is no! The disease is just getting started. If you find it in Wisconsin right now, it will be at low severity and is low in the canopy on leaves that are not going to contribute to yield. My advice is to use your prior knowledge of where tar spot occurred and the Tarspotter tool to help guide your scouting efforts. Get out into the fields and know what you are dealing with. Figure 3 shows various severity levels on a corn leaf. We don’t start to see yield loss until we reach about 10% severity on the ear leaves or above. Thus, you have time! Target fields planted to known susceptible hybrids. Get yourself prepared and use those lower leaves to monitor severity and tar spot progress. Be ready to protect (put fungicide on) those leaves that contribute to yield (ear leaf and above), later on especially if the weather becomes increasingly conducive (think wet/dry cycles!) and/or your scouting indicates severity is increasing.

When should I spray fungicide? What should I use?

Figure 3. Tar spot severity diagram indicating various levels of tar spot on corn leaves. Yield loss isn’t typically detectable in the field until severity reaches 10% or more on the ear leaf or leaves above this leaf.

Our recent work has shown that if you get the product right, you can generally control tar spot to the point to preserve your yield potential, with one well timed spray. So what is that timing of the single application? That would be between the VT (tasseling) and R3 (milk) growth stages. We determined this using a series of trials where we did single applications of fungicide for individual growth stages. Figure 4 shows the results of two trials from 2020 where the window of opportunity to reduce the severity of tar spot with a single application is between VT and R3. Yes, the two-spray program (V8+VT) did also control tar spot, but all the work was done by the VT application, not the V8-timed spray! Thus, if you chose to spray your 2023 crop at this point in the season, you stand a good chance of having to come back with a second application later in the season.

Also notice in figure 4 that Tarspotter was tested in 2020 and did not perform very well. This was an early iteration of the tool and we have since improved its performance. So please don’t judge the tool based on this figure. If you would like to see how Tarspotter performed in advising fungicide applications last season, check out this article based on the 2021 field season.

Now the questions is what fungicide should you choose? The short answer is that you have lots of options. You can learn more about fungicides and fungicide performance by CLICKING HERE. You can also check out the efficacy of various fungicides based on a collective of University research by viewing the “Fungicide Efficacy for Control of Corn Diseases” on the Crop Protection Network website. In addition, Dr. Darcy Telenko at Purdue University led an effort to publish data from a multi-state coordinated fungicide trial where we tested various fungicides during the 2021 epidemic.

Figure 4. Tar spot intensity after spraying fungicide once at each corn growth stage during the 2020 field season.


Figures 5 shows the tar spot severity, while figure 6 the corn yield, from those trials where a single application of each of the products was made at the VT growth stage. Clearly you have lots of options when it comes to products that can control tar spot. That is good news! Yes, some products do a bit better in preserving yield over others, but all fungicides tested in 2021 resulted in numerically higher yields than not-treating. Remember that 2021 was a banner year for tar spot. These results might not be as clear in a year where tar spot is not as intense.

Figure 5. Tar spot severity from multi-state trials where corn was treated with foliar fungicides at the VT corn growth stage, or not treated. Source: Telenko et al., 2022 – https://apsjournals.apsnet.org/doi/10.1094/PHP-02-22-0012-BR.

Figure 6. Corn yield from multi-state trials where corn was treated with foliar fungicides at the VT corn growth stage, or not treated. Source: Telenko et al., 2022 – https://apsjournals.apsnet.org/doi/10.1094/PHP-02-22-0012-BR.

The Conclusion

DON’T PANIC! This is just a call to be ready. Download the apps and know what the weather is doing. Use your prior knowledge and scouting in key locations to track tar spot. Get your management plan in place. Have your fungicide of choice available. Communicate with your custom applicator. Be ready to spray between the VT and R3 growth stages if you plan to use just one fungicide application and you are seeing tar spot increase. If you spray between the V8 and VT growth stages, be ready to monitor the smartphone apps and do more scouting as you might have to pull the trigger again later in the season. Get out and SCOUT, SCOUT, SCOUT!

Other Resources

Wisconsin Corn and Soybean Disease Update and Forecast – July 21, 2022

Damon Smith, Extension Field Crops Pathologist, Department of Plant Pathology, University of Wisconsin-Madison

Roger Schmidt, Nutrient and Pest Management Program, University of Wisconsin-Madison

Rain, and the return of more humid weather, has meant that risk of tar spot of corn and white mold of soybean has increased over the past week. Now is the time to think about your in-season management plan for both of these diseases. Let’s dig in a bit on what the risk looks like for each disease.

Tar Spot of Corn

This week we added Fond du Lac County to the tar spot map (Fig. 1). We also continue to see tar spot slowly increasing in plots and production fields on the Arlington research station. Looking back at our records from last season, we are tracking almost identically with what happened last year. I know folks think it is dry, but the tar spot fungus doesn’t care. It might move slow in these conditions, but the elevated humidity provides adequate leaf wetness for the disease to slowly progress. Should it start raining more regularly I expect the disease to pick up speed.

Corn is rapidly approaching (if not already at) the optimal window of opportunity (VT-R3) for spraying fungicide to control tar spot. Given the high risk for tar spot across much of the state (Fig. 2), now is the time to call in that fungicide application if you are planning on it. Given the possible constraints on locating a custom applicator, getting the order in earlier than later may ensure application of fungicide by the R3 corn growth stage. Get out and scout, scout, scout!

Figure 2. Tar Spot Risk for Wisconsin on July 21, 2022

White Mold of Soybean

White mold risk has increased from reasonably low last week, to mostly moderate across the state, this week (Fig. 3). Risk trends are also increasing, indicating that weather is continuing to become more favorable for white mold development. As we approach the R3 soybean growth stage, it will be important to make a decision on fungicide application, especially if you haven’t already applied a fungicide. If rain moves in over the next 7-10 days, expect risk to continue to increase. In irrigated fields we have been able to find apothecia (the mushroom-like structure that produces spores that infect soybean). This corroborates the increased risk we are seeing even in non-irrigated fields.

Figure 3. White mold risk in Wisconsin for July 21, 2022.

The Field Prophet Tool

For those who like all of their disease prediction tools in one place you might check out the Field Prophet version of the Tarspotter and Sporecaster apps. This tool consolidates all of our disease prediction tools into one convenient tool. The app also allows for true 7-day forecasting and will display 7-day trends to better inform your disease management decisions. Field Prophet, Inc is a startup company supported by UW-Madison and uses science-based information and the same models as Tarspotter and Sporecaster to deliver informative tools for agriculture clientele. You can also download and use Field Prophet for free for the next 6 months! You might find this tool as a handy alternative to Tarspotter and Sporecaster.


Wisconsin Corn and Soybean Disease Update and Forecast – July 14, 2022

Damon Smith, Extension Field Crops Pathologist, Department of Plant Pathology, University of Wisconsin-Madison

Roger Schmidt, Nutrient and Pest Management Program, University of Wisconsin-Madison

Weather over the last week has been generally drier with milder temperatures in most of Wisconsin. Isolated storms have occurred and periods of leaf wetness have prevailed. So what does that mean for important plant diseases of corn and soybeans? Let’s break that down.

Tar Spot of Corn

As noted last week we found tar spot in Columbia county Wisconsin, which was the first report for 2022. This week we add Dane County to the list (Fig. 1). Tarspotter risk has remained high for much of the state over the last week due to milder temperatures and periods of leaf wetting events. It is important to note that conditions favorable for tar spot development are different than those for white mold in soybean. For white mold rain, more sustained wetting events, and cooler temperatures are required (see below). As of today (July 14, 2022) tar spot risk remains high or elevated for most of the state (Fig. 2). Over the next week the forecast is putting us a bit drier and hotter. Thus, the tar spot risk could continue to decline. However, remember that tar spot will continue to show up due to favorable weather 2 or more weeks back. The tar spot pathogen has a long incubation period (time from infection to tar spot appearance). Thus, you shouldn’t be surprised in finding tar spot at low levels over the next week. So should you spray fungicide now? If you can, wait until at least the VT (tasseling growth stage). The evidence is strong that the optimum window to spray fungicide to control tar spot is between the VT and R3 (milk) growth stages. Spraying before VT might leave corn plants vulnerable to a late-season tar spot increase. Thus, if you spray before VT, you might need to come back with a second application of fungicide closer to the R3 growth stage. For guidance on when/if to spray fungicide to manage tar spot, see my previous article.

Figure 2. Tar spot risk for Wisconsin on July 14, 2022.

White Mold of Soybean

White mold risk remains generally low and is dropping for most of the state of Wisconsin (Fig. 3). This is not surprising as temperatures have remained moderate with drier conditions. Based on the current risk and the 7-day forecast, fungicide applications can be held back. Folks should pay attention to the weather and Sporecaster risk as the crop moves into full bloom and early pod development. In recent years we have seen white mold risk increase during the late bloom time necessitating a fungicide application around the R3 growth stage. I would expect this same scenario to set up in 2022 in at least a portion of Wisconsin. Folks should monitor this situation carefully as we move ahead over the next 2 weeks. For more information on white mold and making the fungicide spray decision, see this previous article.

Figure 3. White mold risk for Wisconsin for July 14, 2022.

The Field Prophet Tool

For those who like all of their disease prediction tools in one place you might check out the Field Prophet version of the Tarspotter and Sporecaster apps. This tool consolidates all of our disease prediction tools into one convenient tool. The app also allows for true 7-day forecasting and will display 7-day trends to better inform your disease management decisions. Field Prophet, Inc is a startup company supported by UW-Madison and uses science-based information and the same models as Tarspotter and Sporecaster to deliver informative tools for agriculture clientele. You can also download and use Field Prophet for free for the next 6 months! You might find this tool as a handy alternative to Tarspotter and Sporecaster.

We Found Tar Spot of Corn in 2022, Now What?

Damon Smith, Extension Field Crops Pathologist, Department of Plant Pathology, University of Wisconsin-Madison

Brian Mueller, Researcher II, Department of Plant Pathology, University of Wisconsin-Madison

Roger Schmidt, Nutrient and Pest Management Program, University of Wisconsin-Madison

It didn’t take long this year to find tar spot in the corn crop in the Midwest. Last week brought on the first county-wide reports of tar spot in Iowa and now we have found tar spot on corn in Columbia Co. Wisconsin as of July 6, 2022 (Fig 1). This is the earliest in the season, and the earliest growth stage of corn, that I have ever seen tar spot in Wisconsin. With that said, the severity is extremely low and does not necessitate spraying fungicide at the moment! So what should you do now?

Figure 1. Map of U.S. counties where tar spot has been confirmed in the 2022 season, as of July 7, 2022. Map source: https://corn.ipmpipe.org/tarspot/.

What should I do?

My advice is to get prepared and make sure you have the tools in place to deal with this problem. As I said last season, tar spot is here to stay and we need to simply be prepared and ready to fight the disease. The first line of defense is to know if you have had tar spot before. This will tell you if there is resident inoculum sources present that can initiate epidemics. If you have seen tar spot on your farm before, then assume the pathogen is present and in close proximity to corn (the host). Remember the disease triangle? The last component of the triangle is the weather. If there has been conducive weather then the triangle has been met and risk is high for finding tar spots. So how do you know if the weather is conducive? Well, there is an app for that!

Tarspotter and Field Prophet are both Smartphone applications that can help you determine if the weather has been conducive to put your corn crop at high risk of tar spot development. Figure 2 shows a map of Wisconsin from the Field Prophet version of the tool that is showing that weather has been highly conducive for the development of tar spots. The app DOES NOT tell you if the pathogen is present. We are working on this part of the triangle to improve our predictions, but you need to determine if the pathogen is present in your field. This tool just tells you if the weather has been conducive.

Figure 2. A Screen shot of a map developed in the Field Prophet app showing risk for tar spot development in Wisconsin as of July 7, 2022.

So what weather is conducive for tar spot development? Well, it is different that the weather needed to grow corn. Yes, precipitation is helpful, but more importantly, we need leaf wetness. Specifically leaf wetness at night. What gives leaf wetness this time of year other than rain? That would be high dew points and humidity. These variables are included in the models that run in Tarspotter and Field Prophet. We also include temperature (not as important as you think it would be) and precipitation. These variables are measured over the last 14 days and included in each daily run of the tool. We use the GPS on the smartphone to pull down cloud-based weather for a precise location. Thus, these results are site-specific. I also like to the use the Field Prophet version of the models as this version provides a 7-day trend line on how weather has been progressing and also allows for a true 7-day forecast. These additional tools can better help with the decision-making process.

My corn is at V8 or V10, should I spray Fungicide?

My short answer is no! The disease is just getting started. It is at low severity (Fig. 3) and is low in the canopy on leaves that are not going to contribute to yield. My advice is to use your prior knowledge of where tar spot occurred and the Tarspotter tool to help guide your scouting efforts. Get out into the fields and know what you are dealing with. Target field planted to known susceptible hybrids. Get yourself prepared and use those lower leaves to monitor severity and tar spot progress. Be ready to protect (put fungicide on) those leaves that contribute to yield (ear leaf and above), later on.

When should I spray fungicide? What should I use?

Figure 3. A single tar spot on a lower leaf of corn in Wisconsin on July 6, 2022.

Our recent work has shown that if you get the product right, you can generally control tar spot to the point to preserve your yield potential, with one well timed spray. So what is that timing of the single application? That would be between the VT (tasseling) and R3 (milk) growth stages. We determined this using a series of trials where we did single applications of fungicide for individual growth stages. Figure 4 shows the results of two trials from 2020 where the window of opportunity to reduce the severity of tar spot with a single application is between VT and R3. Yes, the two-spray program (V8+VT) did also control tar spot, but all the work was done by the VT application, not the V8-timed spray! Thus, if you chose to spray your 2022 crop at this point in the season, you stand a good chance of having to come back with a second application later in the season.

Also notice in figure 4 that Tarspotter was tested in 2020 and did not perform very well. This was an early iteration of the tool and we have since improved its performance. So please don’t judge the tool based on this figure. If you would like to see how Tarspotter performed in advising fungicide applications last season, check out this article based on the 2021 field season.

Now the questions is what fungicide should you choose? The short answer is that you have lots of options. You can learn more about fungicides and fungicide performance by CLICKING HERE. You can also check out the efficacy of various fungicides based on a collective of University research by viewing the “Fungicide Efficacy for Control of Corn Diseases” on the Crop Protection Network website. In addition, Dr. Darcy Telenko at Purdue University led an effort to publish data from a multi-state coordinated fungicide trial where we tested various fungicides during the 2021 epidemic.

Figure 4. Tar spot intensity after spraying fungicide once at each corn growth stage during the 2020 field season.


Figures 5 shows the tar spot severity, while figure 6 the corn yield, from those trials where a single application of each of the products was made at the VT growth stage. Clearly you have lots of options when it comes to products that can control tar spot. That is good news! Yes, some products do a bit better in preserving yield over others, but all fungicides tested in 2021 resulted in numerically higher yields than not-treating. Remember that 2021 was a banner year for tar spot. These results might not be as clear in a year where tar spot is not as intense.

Figure 5. Tar spot severity from multi-state trials where corn was treated with foliar fungicides at the VT corn growth stage, or not treated. Source: Telenko et al., 2022 – https://apsjournals.apsnet.org/doi/10.1094/PHP-02-22-0012-BR.

Figure 6. Corn yield from multi-state trials where corn was treated with foliar fungicides at the VT corn growth stage, or not treated. Source: Telenko et al., 2022 – https://apsjournals.apsnet.org/doi/10.1094/PHP-02-22-0012-BR.

The Conclusion

DON’T PANIC! This is just a call to be ready. Download the apps and know what the weather is doing. Use your prior knowledge and scouting in key locations to track tar spot. Get your management plan in place. Have your fungicide of choice available. Communicate with your custom applicator. Be ready to spray between the VT and R3 growth stages if you plan to use just one fungicide application and you are seeing tar spot increase. If you spray between the V8 and VT growth stages, be ready to monitor the smartphone apps and do more scouting as you might have to pull the trigger again later in the season. Get out and SCOUT, SCOUT, SCOUT!

Other Resources