We Found Tar Spot of Corn in 2022, Now What?
Damon Smith, Extension Field Crops Pathologist, Department of Plant Pathology, University of Wisconsin-Madison
Brian Mueller, Researcher II, Department of Plant Pathology, University of Wisconsin-Madison
Roger Schmidt, Nutrient and Pest Management Program, University of Wisconsin-Madison
It didn’t take long this year to find tar spot in the corn crop in the Midwest. Last week brought on the first county-wide reports of tar spot in Iowa and now we have found tar spot on corn in Columbia Co. Wisconsin as of July 6, 2022 (Fig 1). This is the earliest in the season, and the earliest growth stage of corn, that I have ever seen tar spot in Wisconsin. With that said, the severity is extremely low and does not necessitate spraying fungicide at the moment! So what should you do now?
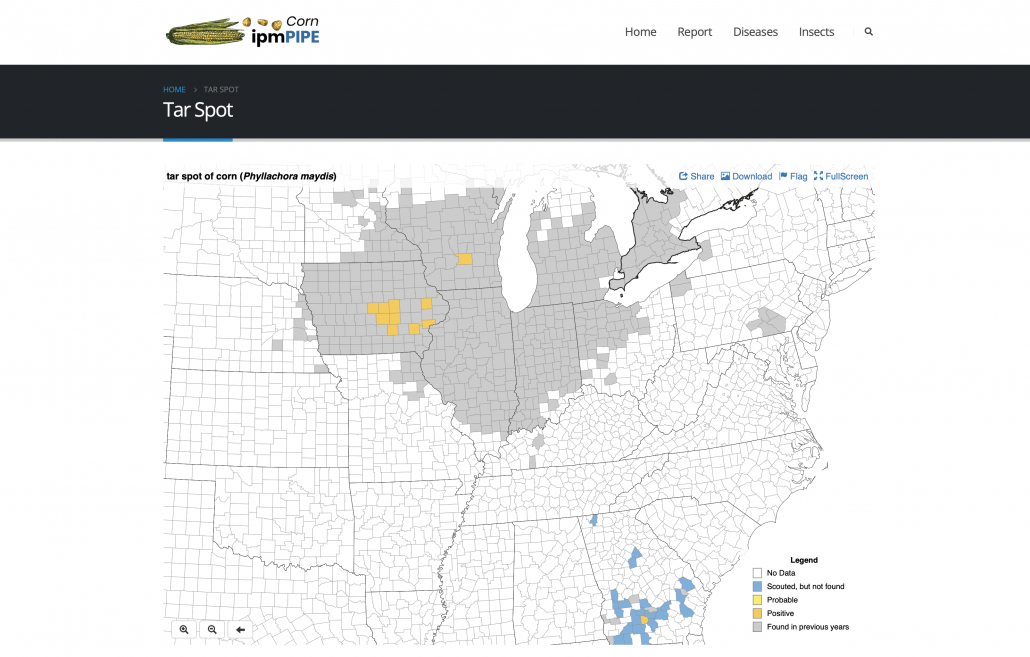
Figure 1. Map of U.S. counties where tar spot has been confirmed in the 2022 season, as of July 7, 2022. Map source: https://corn.ipmpipe.org/tarspot/.
What should I do?
My advice is to get prepared and make sure you have the tools in place to deal with this problem. As I said last season, tar spot is here to stay and we need to simply be prepared and ready to fight the disease. The first line of defense is to know if you have had tar spot before. This will tell you if there is resident inoculum sources present that can initiate epidemics. If you have seen tar spot on your farm before, then assume the pathogen is present and in close proximity to corn (the host). Remember the disease triangle? The last component of the triangle is the weather. If there has been conducive weather then the triangle has been met and risk is high for finding tar spots. So how do you know if the weather is conducive? Well, there is an app for that!
Tarspotter and Field Prophet are both Smartphone applications that can help you determine if the weather has been conducive to put your corn crop at high risk of tar spot development. Figure 2 shows a map of Wisconsin from the Field Prophet version of the tool that is showing that weather has been highly conducive for the development of tar spots. The app DOES NOT tell you if the pathogen is present. We are working on this part of the triangle to improve our predictions, but you need to determine if the pathogen is present in your field. This tool just tells you if the weather has been conducive.
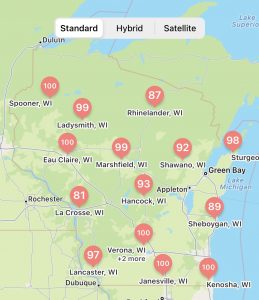
Figure 2. A Screen shot of a map developed in the Field Prophet app showing risk for tar spot development in Wisconsin as of July 7, 2022.
So what weather is conducive for tar spot development? Well, it is different that the weather needed to grow corn. Yes, precipitation is helpful, but more importantly, we need leaf wetness. Specifically leaf wetness at night. What gives leaf wetness this time of year other than rain? That would be high dew points and humidity. These variables are included in the models that run in Tarspotter and Field Prophet. We also include temperature (not as important as you think it would be) and precipitation. These variables are measured over the last 14 days and included in each daily run of the tool. We use the GPS on the smartphone to pull down cloud-based weather for a precise location. Thus, these results are site-specific. I also like to the use the Field Prophet version of the models as this version provides a 7-day trend line on how weather has been progressing and also allows for a true 7-day forecast. These additional tools can better help with the decision-making process.
My corn is at V8 or V10, should I spray Fungicide?
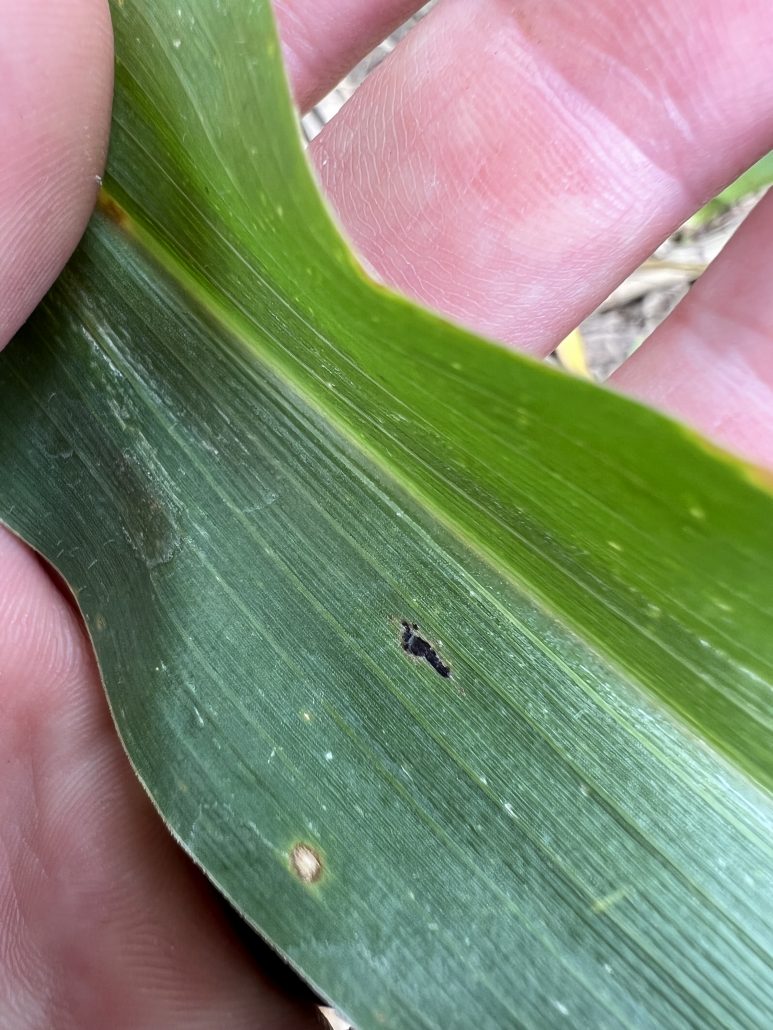
My short answer is no! The disease is just getting started. It is at low severity (Fig. 3) and is low in the canopy on leaves that are not going to contribute to yield. My advice is to use your prior knowledge of where tar spot occurred and the Tarspotter tool to help guide your scouting efforts. Get out into the fields and know what you are dealing with. Target field planted to known susceptible hybrids. Get yourself prepared and use those lower leaves to monitor severity and tar spot progress. Be ready to protect (put fungicide on) those leaves that contribute to yield (ear leaf and above), later on.
When should I spray fungicide? What should I use?

Figure 3. A single tar spot on a lower leaf of corn in Wisconsin on July 6, 2022.
Our recent work has shown that if you get the product right, you can generally control tar spot to the point to preserve your yield potential, with one well timed spray. So what is that timing of the single application? That would be between the VT (tasseling) and R3 (milk) growth stages. We determined this using a series of trials where we did single applications of fungicide for individual growth stages. Figure 4 shows the results of two trials from 2020 where the window of opportunity to reduce the severity of tar spot with a single application is between VT and R3. Yes, the two-spray program (V8+VT) did also control tar spot, but all the work was done by the VT application, not the V8-timed spray! Thus, if you chose to spray your 2022 crop at this point in the season, you stand a good chance of having to come back with a second application later in the season.
Also notice in figure 4 that Tarspotter was tested in 2020 and did not perform very well. This was an early iteration of the tool and we have since improved its performance. So please don’t judge the tool based on this figure. If you would like to see how Tarspotter performed in advising fungicide applications last season, check out this article based on the 2021 field season.
Now the questions is what fungicide should you choose? The short answer is that you have lots of options. You can learn more about fungicides and fungicide performance by CLICKING HERE. You can also check out the efficacy of various fungicides based on a collective of University research by viewing the “Fungicide Efficacy for Control of Corn Diseases” on the Crop Protection Network website. In addition, Dr. Darcy Telenko at Purdue University led an effort to publish data from a multi-state coordinated fungicide trial where we tested various fungicides during the 2021 epidemic.
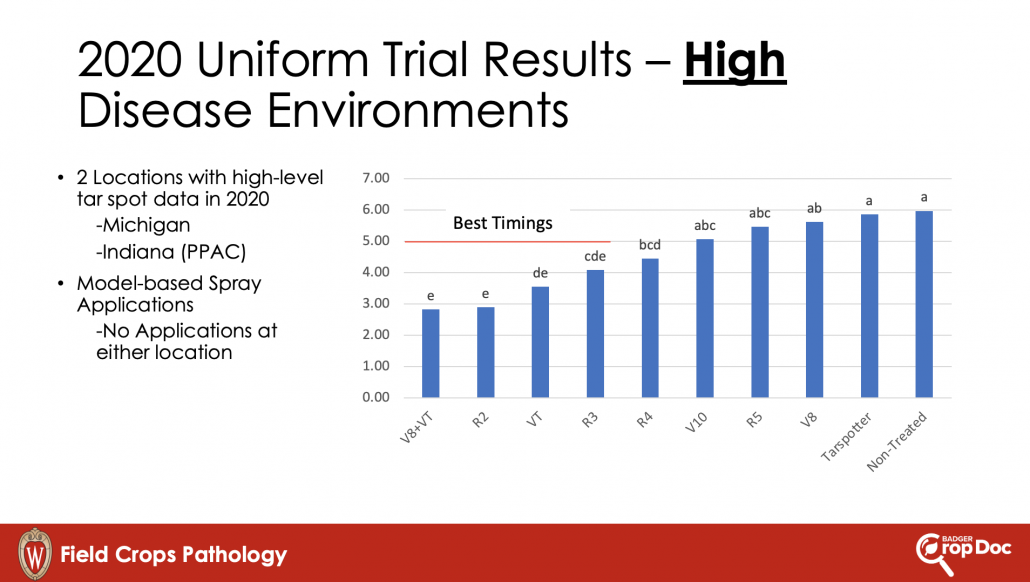
Figure 4. Tar spot intensity after spraying fungicide once at each corn growth stage during the 2020 field season.
Figures 5 shows the tar spot severity, while figure 6 the corn yield, from those trials where a single application of each of the products was made at the VT growth stage. Clearly you have lots of options when it comes to products that can control tar spot. That is good news! Yes, some products do a bit better in preserving yield over others, but all fungicides tested in 2021 resulted in numerically higher yields than not-treating. Remember that 2021 was a banner year for tar spot. These results might not be as clear in a year where tar spot is not as intense.
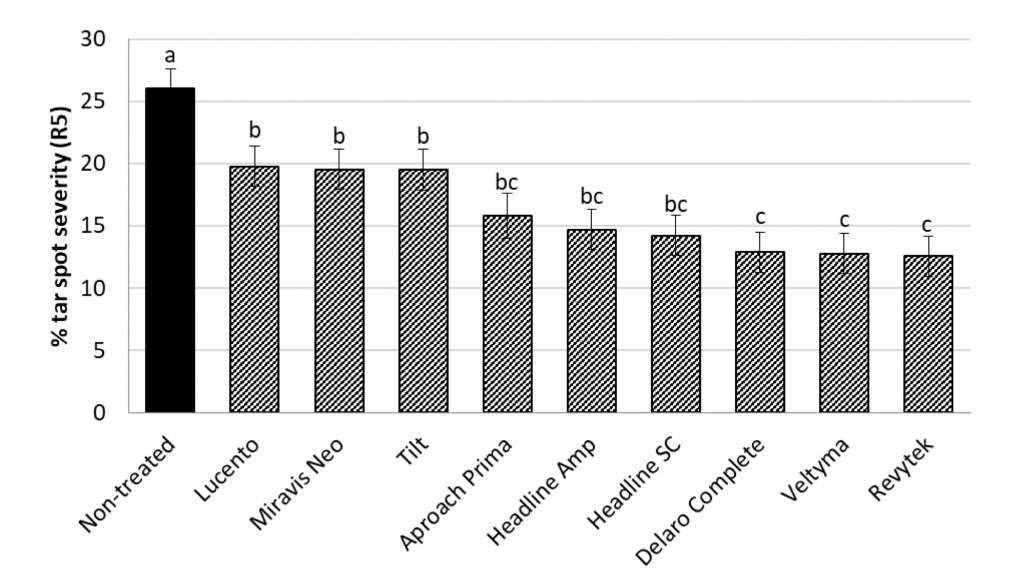
Figure 5. Tar spot severity from multi-state trials where corn was treated with foliar fungicides at the VT corn growth stage, or not treated. Source: Telenko et al., 2022 – https://apsjournals.apsnet.org/doi/10.1094/PHP-02-22-0012-BR.
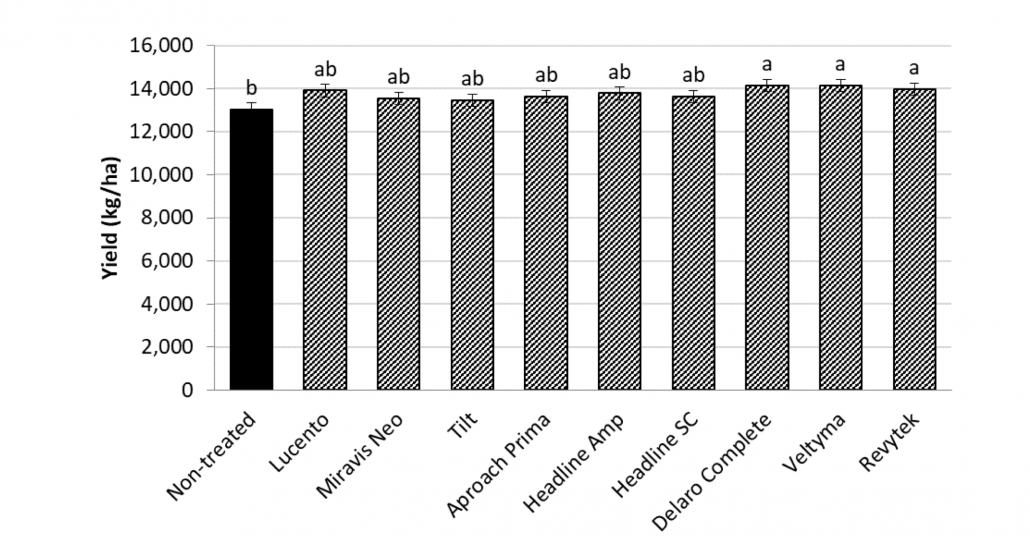
Figure 6. Corn yield from multi-state trials where corn was treated with foliar fungicides at the VT corn growth stage, or not treated. Source: Telenko et al., 2022 – https://apsjournals.apsnet.org/doi/10.1094/PHP-02-22-0012-BR.
The Conclusion
DON’T PANIC! This is just a call to be ready. Download the apps and know what the weather is doing. Use your prior knowledge and scouting in key locations to track tar spot. Get your management plan in place. Have your fungicide of choice available. Communicate with your custom applicator. Be ready to spray between the VT and R3 growth stages if you plan to use just one fungicide application and you are seeing tar spot increase. If you spray between the V8 and VT growth stages, be ready to monitor the smartphone apps and do more scouting as you might have to pull the trigger again later in the season. Get out and SCOUT, SCOUT, SCOUT!
Other Resources