Wisconsin Corn Tar Spot Update – July 29, 2020

Damon Smith, Extension Field Crops Pathologist, Department of Plant Pathology, University of Wisconsin-Madison

Roger Schmidt, Nutrient and Pest Management Program, University of Wisconsin-Madison

No new county level first-detects of tar spot in Wisconsin have been added to the national tar spot map this week (Fig. 1). This week we are seeing just a a handful of new counties added in the Midwest corn belt. Note that all county level confirmations for 2020 are in areas where the disease has been previously reported.

Figure 1. Corn IpmPIPE tar spot confirmations for U.S. Counties as of July 29, 2020. Grey shading indicates past confirmation in the county. Orange shading indicates a positive confirmation for 2020. Yellow shading indicates a probable positive.

Figure 2. Tar Spot risk for various locations in Wisconsin for July 29, 2020.

Figure 2 shows the calculated risk from Tarspotter (our smartphone prediction tool for tar spot) for July 29, 2020, for various locations in Wisconsin. The action threshold for high risk is 75% using the updated Tarspotter model for 2020. As you can see, the present risk has continued to decline overall for the entire state with the exception of the far Northwest, where there is not a history of tar spot. Continued dryer and warm weather is less conducive for the development of tar spot, thus we see the risk continuing to decline. So while we can find tar spot in handful of fields, progress of the disease is slow. Remember, tar spot is favored by persistent temperatures between 60 and 70 F and high relative humidity averaging above 75% for a 30-day period, accompanied by extended periods of leaf wetness caused by dew, rain, or irrigation events. The newest Tarspotter tool captures all of these aspects and balances these in the calculations of risk in the map above.

The Recommendation

Tassels and silks have been out in the southern portion of the state. We are now in the tail-end of the window of opportunity for a fungicide application if you feel the risk for disease, including tar spot, is warranted. While tar spot is slow to develop, we have seen gray leaf spot (GLS) developing in the lower canopy and moving up. We continue to also scout for southern rust, but have had no confirmations of this disease so far in Wisconsin.

Do some scouting and check weather reports. If it is dry in your area and has been hot, then no disease may be present. You might be able to hold off on that fungicide application. If it has been humid and rainy and you have some disease present in the lower canopy, then a fungicide application might be warranted. Now is the critical time to pay attention to disease development and make a final fungicide spray decision. See my previous post for more information about making the decision to spray fungicide on corn.

More Tar Spot Information

  1. Tar Spot Fact sheet (Updated for 2020!)
  2. Short Tar Spot Video
  3. Tar Spot Webinar 
  4. Corn Fungicide Efficacy Table

Wisconsin Soybean White Mold Update – July 23, 2020

Damon Smith, Extension Field Crops Pathologist, Department of Plant Pathology, University of Wisconsin-Madison

Shawn Conley, Extension Soybean and Small Grains Agronomist, Department of Agronomy, University of Wisconsin-Madison

Roger Schmidt, Nutrient and Pest Management Program, University of Wisconsin-Madison

Figure 1. Sporecaster predictions for selected non-irrigated locations in Wisconsin for July 23, 2020.

Figure 1 illustrates the calculated risk of white mold for select Wisconsin locations for non-irrigated soybeans, as determined by Sporecaster for July 23, 2020. This means that if soybeans are flowering and the area between rows is filled in more than 50%, risk is just moderate in most locations of the state, with the exception of the far northern portions of the state and Door County. This moderate risk indicates that there may not be apothecia present in fields in these locations at this time, with reduced risk of subsequent white mold development due to hot and dry conditions. Remember that this season, you have the ability to change the action threshold for each field in the app. Last season the action threshold was locked at 40%, which is still a reasonable threshold for Wisconsin. Thus, figure 1 risk is calculated based on 40%. You can tailor this threshold to your liking based on your prior knowledge of a field, or your acceptable risk level. Further tailored predictions for irrigated locations and locations planted to narrower row-spacing can be run by downloading the Sporecaster app to your smartphone.

We are finding risk to be higher for irrigated locations. As expected, we found apothecia (Fig. 2) present in our irrigated research location on the Hancock Agricultural Research Station located in Hancock, Wisconsin. Irrigated environments are often highly conducive for white mold development.

I’m Ready To Spray, What Should I use?

Figure 2. An apothecium of the white mold fungus. The dime is included for size comparison.

If the canopy has met threshold, soybeans are flowering, and your Sporecaster risk is high, then a fungicide might be warranted. If you have decided to spray soybeans for white mold, what are the best products to use? I have written extensively about this in a previous post which you can find HERE. Over the last several years we have run numerous fungicide efficacy trials in Wisconsin and in conjunction with researchers in other states. In Wisconsin, we have observed that Endura applied at 8 oz once between the R1 and R3 growth stages performs well. We have also observed that the fungicide Aproach applied at 9 fl oz at R1 and again at R3 also performs comparably to the Endura treatment. Other fungicide options also include Omega and Proline. You can view results of past fungicide evaluations for Wisconsin by CLICKING HERE. If you would like to run tailored estimations of return on investment for various fungicide programs, you can use another smartphone application called Sporebuster.

Helpful Smartphone Application Links

Sporecaster

  1. Click here to download the Android version of Sporecaster. 
  2. Click here to download the iPhone version of Sporecaster.
  3. Here is a helpful video if you would like some tips on how to use Sporecaster.

Sporebuster

  1. Click here to download the Android version of Sporebuster.
  2. Click here to download the iPhone version of Sporebuster.
  3. Here is a video on how to use Sporebuster and interpret the output.

Other White Mold Resources

  1. To watch an in-depth video on white mold management, CLICK HERE.
  2. To find more information and download a fact sheet on white mold from the Crop Protection Network, CLICK HERE.

Wisconsin Corn Tar Spot Update – July 23, 2020

Damon Smith, Extension Field Crops Pathologist, Department of Plant Pathology, University of Wisconsin-Madison

Roger Schmidt, Nutrient and Pest Management Program, University of Wisconsin-Madison

No new county level first-detects of tar spot in Wisconsin have been added to the national tar spot map this week (Fig. 1). This week we are seeing more counties being added now in Iowa, Illinois, Indiana, and Michigan. Note that all county level confirmations for 2020 are in areas where the disease has been previously reported.


Figure 1. Corn IpmPIPE tar spot confirmations for U.S. Counties as of July 23, 2020. Grey shading indicates past confirmation in the county. Orange shading indicates a positive confirmation for 2020.


Figure 2. Tar Spot risk for various locations in Wisconsin for July 23, 2020.

Figure 2 shows the calculated risk from Tarspotter (our smartphone prediction tool for tar spot) for July 23, 2020, for various locations in Wisconsin. The action threshold for high risk is 75% using the updated Tarspotter model for 2020. As you can see, the present risk has declined overall for most of the state with exceptions for south-central and far Northwest Wisconsin. Dryer and warmer weather is less conducive for the development of tar spot, thus we see the risk slowly declining. Remember, tar spot is favored by persistent temperatures between 60 and 70 F and high relative humidity averaging above 75% for a 30-day period, accompanied by extended periods of leaf wetness caused by dew, rain, or irrigation events. The newest Tarspotter tool captures all of these aspects and balances these in the calculations of risk in the map above.

The Recommendation

Tassels and silks are out in the southern portion of the state. We are now in the window of opportunity for a fungicide application if you feel the risk for disease, including tar spot, is warranted. While tar spot is slow to develop, we have seen gray leaf spot (GLS) developing in the lower canopy and moving up. Do some scouting and check weather reports. If it is dry in your area and has been hot, then no disease may be present. You might be able to hold off on that fungicide application. If it has been humid and rainy and you have some disease present in the lower canopy, then a fungicide application might be warranted. Now is the critical time to pay attention to disease development and make a fungicide spray decision. See my previous post for more information about making the decision to spray fungicide on corn.

More Tar Spot Information

  1. Tar Spot Fact sheet (Updated for 2020!)
  2. Short Tar Spot Video
  3. Tar Spot Webinar 
  4. Corn Fungicide Efficacy Table

Wisconsin Corn Tar Spot Update – July 14, 2020

Damon Smith, Extension Field Crops Pathologist, Department of Plant Pathology, University of Wisconsin-Madison

Roger Schmidt, Nutrient and Pest Management Program, University of Wisconsin-Madison

Last week brought our first detect of tar spot in Wisconsin for the 2020 field season. This week we are seeing more counties being added now in Iowa and Indiana, with some additional non-confirmed reports from southwest Wisconsin. Figure 1, show the location of the confirmed detections, which are all in the previously recorded range of the tar spot pathogen.

Figure 1. Corn IpmPIPE tar spot confirmations for U.S. Counties as of July 14, 2020. Grey shading indicates past confirmation in the county. Orange shading indicates a positive confirmation for 2020.

Figure 2. Tar Spot risk for various locations in Wisconsin for July 14, 2020.

Figure 2 shows the calculated risk from Tarspotter (our smartphone prediction tool for tar spot) for July 14, 2020, for various locations in Wisconsin. Figure 3 shows the risk for locations in southern and south-central Wisconsin. The action threshold for high risk is 75% using the updated Tarspotter model for 2020. As you can see, the present risk is elevated in much of the southern and southwestern portion of the state, the areas where reports are coming in. This is due to the fact that the weather continues to be relatively wet and humid for the past 30 days with decent rainfall. Cooler conditions this week are also contributing to the rising risk. Tar spot is favored by persistent temperatures between 60 and 70 F and high relative humidity averaging above 75% for a 30-day period, accompanied by extended periods of leaf wetness caused by dew, rain, or irrigation events. The newest Tarspotter tool captures all of these aspects and balances these in the calculations of risk in the map above.

The Recommendation

Figure 3. Tar spot risk for the southern and south-central zones of Wisconsin for July 14, 2020.

Tassels are starting to peek or are out in the southern portion of the state. We are now in the window of opportunity for a fungicide application if you feel the risk for disease, including tar spot, is warranted. Do some scouting and check weather reports. If it is dry in your area and has been hot, then no disease may be present. You might be able to hold off on that fungicide application. If it has been humid and rainy and you have some disease present in the lower canopy, then a fungicide application might be warranted. See my previous post for more information about making the decision to spray fungicide on corn.

More Tar Spot Information

  1. Tar Spot Fact sheet (Updated for 2020!)
  2. Short Tar Spot Video
  3. Tar Spot Webinar 
  4. Corn Fungicide Efficacy Table

Wisconsin Soybean White Mold Update – July 14, 2020

Damon Smith, Extension Field Crops Pathologist, Department of Plant Pathology, University of Wisconsin-Madison

Shawn Conley, Extension Soybean and Small Grains Agronomist, Department of Agronomy, University of Wisconsin-Madison

Roger Schmidt, Nutrient and Pest Management Program, University of Wisconsin-Madison

Figure 1. Sporecaster predictions for selected non-irrigated locations in Wisconsin for July 14, 2020.

Figure 1 illustrates the calculated risk of white mold for select Wisconsin locations for non-irrigated soybeans, as determined by Sporecaster for July 14, 2020. This means that if soybeans are flowering and the area between rows is filled in more than 50%, risk ranges from medium in the southern and western regions of the state to high in the central and northeastern regions for the presence of apothecia and subsequent white mold development. Remember, canopy closure is critical in calculating the probability of apothecial presence and subsequent white mold risk. DON’T CHEAT when using Sporecaster at your own locations! Also remember that this season, you have the ability to change the action threshold for each field. Last season the action threshold was locked at 40%, which is still a reasonable threshold for Wisconsin. Thus, figure 1 risk is calculated based on 40%. You can tailor this threshold to your liking based on your prior knowledge of a field, or your acceptable risk level. Further tailored predictions for irrigated locations and locations planted to narrower row-spacing can be run by downloading the Sporecaster app to your smartphone.

I’m Ready To Spray, What Should I use?

If the canopy has met threshold, soybeans are flowering, and your Sporecaster risk is high, then a fungicide might be warranted. If you have decided to spray soybeans for white mold, what are the best products to use? I have written extensively about this in a previous post which you can find HERE. Over the last several years we have run numerous fungicide efficacy trials in Wisconsin and in conjunction with researchers in other states. In Wisconsin, we have observed that Endura applied at 8 oz once between the R1 and R3 growth stages performs well. We have also observed that the fungicide Aproach applied at 9 fl oz at R1 and again at R3 also performs comparably to the Endura treatment. Other fungicide options also include Omega and Proline. You can view results of past fungicide evaluations for Wisconsin by CLICKING HERE. If you would like to run tailored estimations of return on investment for various fungicide programs, you can use another smartphone application called Sporebuster.

Helpful Smartphone Application Links

Sporecaster

  1. Click here to download the Android version of Sporecaster. 
  2. Click here to download the iPhone version of Sporecaster.
  3. Here is a helpful video if you would like some tips on how to use Sporecaster.

Sporebuster

  1. Click here to download the Android version of Sporebuster.
  2. Click here to download the iPhone version of Sporebuster.
  3. Here is a video on how to use Sporebuster and interpret the output.

Other White Mold Resources

  1. To watch an in-depth video on white mold management, CLICK HERE.
  2. To find more information and download a fact sheet on white mold from the Crop Protection Network, CLICK HERE.

Wisconsin Soybean White Mold Update – July 9, 2020

Damon Smith, Extension Field Crops Pathologist, Department of Plant Pathology, University of Wisconsin-Madison

Shawn Conley, Extension Soybean and Small Grains Agronomist, Department of Agronomy, University of Wisconsin-Madison

Roger Schmidt, Nutrient and Pest Management Program, University of Wisconsin-Madison

Figure 1. Sporecaster predictions for selected non-irrigated locations in Wisconsin for July 9, 2020.

Figure 1 illustrates the calculated risk of white mold for select Wisconsin locations for non-irrigated soybeans, as determined by Sporecaster for July 9, 2020. This means that if soybeans are flowering and the area between rows is filled in more than 50%, risk ranges from medium to high for the presence of apothecia and subsequent white mold development. Remember, canopy closure is critical in calculating the probability of apothecial presence and subsequent white mold risk. DON’T CHEAT when using Sporecaster at your own locations! Tailored predictions for irrigated locations and locations planted to narrower row-spacing can be run by downloading the Sporecaster app to your smartphone.

I’m Ready To Spray, What Should I use?

If the canopy has met threshold, soybeans are flowering, and your Sporecaster risk is high, then a fungicide might be warranted. If you have decided to spray soybeans for white mold, what are the best products to use? I have written extensively about this in a previous post which you can find HERE. Over the last several years we have run numerous fungicide efficacy trials in Wisconsin and in conjunction with researchers in other states. In Wisconsin, we have observed that Endura applied at 8 oz once between the R1 and R3 growth stages performs well. We have also observed that the fungicide Aproach applied at 9 fl oz at R1 and again at R3 also performs comparably to the Endura treatment. Other fungicide options also include Omega and Proline. You can view results of past fungicide evaluations for Wisconsin by CLICKING HERE. If you would like to run tailored estimations of return on investment for various fungicide programs, you can use another smartphone application called Sporebuster.

Helpful Smartphone Application Links

Sporecaster

  1. Click here to download the Android version of Sporecaster. 
  2. Click here to download the iPhone version of Sporecaster.
  3. Here is a helpful video if you would like some tips on how to use Sporecaster.

Sporebuster

  1. Click here to download the Android version of Sporebuster.
  2. Click here to download the iPhone version of Sporebuster.
  3. Here is a video on how to use Sporebuster and interpret the output.

Other White Mold Resources

  1. To watch an in-depth video on white mold management, CLICK HERE.
  2. To find more information and download a fact sheet on white mold from the Crop Protection Network, CLICK HERE.

Wisconsin Corn Tar Spot Update – July 9, 2020

Damon Smith, Extension Field Crops Pathologist, Department of Plant Pathology, University of Wisconsin-Madison

Roger Schmidt, Nutrient and Pest Management Program, University of Wisconsin-Madison

Tar spot has been detected on corn for the first time during the 2020 season, this week in Michigan and Indiana. In both situations these were fields with a history of the disease. Incidence and severity is very low, suggesting that the recent warm, dryer weather may be keeping tar spot in check at these sites. Figure 1, show the location of these detections.

Figure 1. Corn IpmPIPE tar spot confirmations for U.S. Counties as of July 9, 2020. Grey shading indicates past confirmation in the county. Orange shading indicates a positive confirmation for 2020.

Figure 2. Tar Spot risk for various locations in Wisconsin for July 9, 2020.

Figure 2 shows the calculated risk from Tarspotter (our smartphone prediction tool for tar spot) for July 9, 2020, for various locations in Wisconsin. Figure 3 shows the risk for locations in southern and south-central Wisconsin. The action threshold for high risk is 75% using the updated Tarspotter model for 2020. As you can see, the present risk is elevated in much of the southern portion of the state, with areas of high risk in the western half of the state. This is due to the fact that the weather continues to be relatively wet and humid for the past 30 days with decent rainfall across this portion of the state, despite relatively warm temperatures. Tar spot is favored by persistent temperatures between 60 and 70 F and high relative humidity averaging above 75% for a 30-day period, accompanied by extended periods of leaf wetness caused by dew, rain, or irrigation events. The newest Tarspotter tool captures all of these aspects and balances these in the calculations of risk in the map above.

We have been scouting fields in the southern portion of the state where there has been a history of tar spot. We have been unable to find any symptoms of tar spot thus far. Fields generally look disease free, which is common this time of year in Wisconsin.

The Recommendation

Figure 3. Tar spot risk for the southern and south-central zones of Wisconsin for July 9, 2020.

Even if weather turns more favorable for tar spot, evaluate the likelihood that tar spot might develop early in your field. Remember, if you have no history of the disease, then the likelihood of local inoculum being present is low. Saving the fungicide application for later in the season might be a better option. If you have a history and you know you have a susceptible hybrid coupled with a no-till situation, then the risk is higher and you need to evaluate the economics of doing an application of fungicide in early or mid v-stages. Remember, if you do a V6-V8 application of fungicide, conditions could stay conducive later in the season for tar spot. Those early applications will “burn out” by the time the tasseling period rolls around. So if you do (or did) put a fungicide spray on at V6-V8, you might have to come back at VT-R2 with another application to protect plants during the reproductive phase, should favorable conditions for tar spot persist. Keep an eye on the weather and keep scouting!

More Tar Spot Information

  1. Tar Spot Fact sheet (Updated for 2020!)
  2. Short Tar Spot Video
  3. Tar Spot Webinar 
  4. Corn Fungicide Efficacy Table

Time to Think About White Mold Management in Soybeans in Wisconsin

Damon Smith, Extension Field Crops Pathologist, Department of Plant Pathology, University of Wisconsin-Madison

Shawn Conley, Extension Soybean and Small Grains Agronomist, Department of Agronomy, University of Wisconsin-Madison

Roger Schmidt, Nutrient and Pest Management Program, University of Wisconsin-Madison

Paul Mitchell, Extension Economist, Agricultural and Applied Economics, University of Wisconsin-Madison

Figure 1. Apothecia, small mushroom-like structures of the white mold fungus that give rise to spores, which infect soybean flowers

In Wisconsin, the first week of July brings us a heightened awareness of white mold in soybeans, and its management. Late planting in 2019, coupled with cool, wet conditions, meant that there were some areas significantly affected by white mold last season. These conditions led to susceptible bloom time lining up directly with weather conducive for the fungus.

Remember that the white mold fungus infects soybeans through open and senescing flowers, by spores that are born from small mushroom-like structures called apothecia (Fig. 1). Remember that if the bloom period gets extended due to cool weather, this can lead to an extended window for infection by the fungus.Often cool weather is a double whammy as it is good for the white mold fungus and slows down soybean crop development, thereby extending bloom.

While conditions have been hot and dry in parts of the state, other portions have seen wetter conditions. The white mold situation can change rapidly based on weather, thus anticipating favorable conditions for white mold, can help you protect your soybean crop.

Predicting White Mold

Figure 2. Sporecaster predictions for selected non-irrigated locations in Wisconsin for July 3, 2020.

The flowering growth stages are a critical time to manage white mold in-season. You can view a fact sheet and video on the subject. As you probably know, timing in-season fungicide sprays at the correct time during the soybean bloom period can be extremely difficult. To help solve this decision-making issue, models were developed at the University of Wisconsin-Madison in conjunction with Michigan State University and Iowa State University to identify at-risk regions which have been experiencing weather favorable for the development of white mold apothecia. These models predict when apothecia will be present in the field using combinations of 30-day averages of maximum temperature, relative humidity, and wind speed. Using virtually available weather data, predictions can be made in most soybean growing regions. To facilitate precise predictions and make the model user-friendly, we use Sporecaster smartphone application for Android and iPhone.

The purpose of the smartphone app is to assist farmers in making early season management decisions for white mold in soybean. The best time to spray fungicides for white mold is during flowering (R1 and R3 growth stages) when apothecia are present on the soil surface.

Sporecaster uses university research to turn a few simple taps on a smartphone screen into an instant forecast of the risk of apothecia being present in a soybean field, which helps growers predict the best timing for white mold treatment during the flowering period.

University research has indicated that the appearance of apothecia can be predicted using weather data and a threshold of percent soybean canopy row closure in a field. Based on these predictions and crop phenology, site-specific risk values are generated for three scenarios (non-irrigated soybeans, soybeans planted on 15″ row-spacing and irrigated, or soybeans planted on 30″ row-spacing and irrigated). Though not specifically tested we would expect row-spacings of 22 inches or less to have a similar probability response to fungicide as the 15 inch row-spacing.

The Sclerotinia apothecial models that underlie the Sporecaster prediction tool have undergone significant validation in both small test plots and in commercial production fields. In 2017, efficacy trials were conducted at agricultural research stations in Iowa, Michigan, and Wisconsin to identify fungicide application programs and thresholds for model implementation. Additionally, apothecial scouting and disease monitoring were conducted in a total of 60 commercial farmer fields in Michigan, Nebraska, and Wisconsin between 2016 and 2017 to evaluate model accuracy across the growing region. Across all irrigated and non-irrigated locations predictions during the soybean flowering period (R1 to early R4 growth stages) were found to explain end-of-season disease observations with an accuracy of 81.8% using the established probability thresholds now programmed in the app. We have made additional improvements for 2020, to further refine accuracy. So if you have used Sporecaster before, you might want to watch the embedded video above to learn about the changes that were made for 2020 and how to best use Sporecaster. If you want to learn more about the science of Sporecaster, check out the embedded video below.

Not only can users run predictions of risk during the soybean bloom period for any field, you can also set up visual maps to look at multiple sites simultaneously. An example for the state of Wisconsin can be found in figure 2, which represents risk for July 3, 2020 for non-irrigated soybeans. Currently, if soybeans are flowering, risk is moderate to low in the southern third of Wisconsin for non-irrigated soybeans. And higher for flowering soybeans in the northern portions of the state. Check back to this blog regularly as I will post maps like these with interpretation of risk for Wisconsin as we move through the season.

What to Spray for White Mold?

If you have decided to spray soybeans for white mold, what are the best products to use? Over the last several years we have run numerous fungicide efficacy trials in Wisconsin and in conjunction with researchers in other states. In Wisconsin, we have observed that Endura applied at 8 oz at the R1 growth stage performs well. We have also observed that the fungicide Aproach applied at 9 fl oz at R1 and again at R3 also performs comparably to the Endura treatment. Other fungicide options also include Omega and Proline. You can view results of past fungicide evaluations for Wisconsin by CLICKING HERE.If you would like to run tailored estimations of return on investment for various fungicide programs, you can use another smartphone application called Sporebuster.

What is Sporebuster?

When a fungicide application is needed to control white mold in soybeans, Sporebuster can help determine a profitable program. You enter your expected soybean price, expected yield, and treatment cost. Sporebuster instantly compares ten different treatment plans at once to determine average net gain and breakeven probability of each. You can mark, save and share by email, the best plans for your farming operation.

The purpose of Sporebuster is to assist soybean farmers in making a fungicide program decision that is profitable for their operation. Sporebuster is meant to complement Sporecaster. Once Sporecaster recommends a fungicide application, Sporebuster can be used to determine a profitable program.

Information that drives Sporebuster is based on research from 2009-2016 from across the upper Midwestern US. Statistical models were developed based on these data that included white mold pressure and yield response from fungicide for 10 common fungicide programs. Details about the research behind Sporebuster can be found by CLICKING HERE to download a PDF version of a research update on the subject.

Helpful Smartphone Application Links

Sporecaster

  1. Click here to download the Android version of Sporecaster. 
  2. Click here to download the iPhone version of Sporecaster.

Sporebuster

  1. Click here to download the Android version of Sporebuster.
  2. Click here to download the iPhone version of Sporebuster.
  3. Here is a video on how to use Sporebuster and interpret the output.

Other Resources

  1. To watch an in-depth video on white mold management, CLICK HERE.
  2. To find more information and download a fact sheet on white mold from the Crop Protection Network, CLICK HERE.

Scientific References

  1. Willbur, J.F., Fall, M.L., Blackwell, T., Bloomingdale, C.A., Byrne, A.M., Chapman, S.A., Holtz, D., Isard, S.A., Magarey, R.D., McCaghey, M., Mueller, B.D., Russo, J.M., Schlegel, J., Young, M., Chilvers, M.I., Mueller, D.S., and Smith, D.L. Weather-based models for assessing the risk of Sclerotinia sclerotiorum apothecial presence in soybean (Glycine max) fields. Plant Disease. https://doi.org/10.1094/PDIS-04-17-0504-RE
  2. Willbur, J.F.,Fall, M.L., Byrne, A.M., Chapman, S.A., McCaghey, M.M., Mueller, B.D., Schmidt, R., Chilvers, M.I., Mueller, D.S., Kabbage, M., Giesler, L.J., Conley, S.P., and Smith, D.L. Validating Sclerotinia sclerotiorumapothecial models to predict Sclerotinia stem rot in soybean (Glycine max) fields. Plant Disease. https://doi.org/10.1094/PDIS-02-18-0245-RE.
  3. Fall, M., Willbur, J., Smith, D.L., Byrne, A., and Chilvers, M. 2018. Spatiotemporal distribution pattern of Sclerotinia sclerotiorum apothecia is modulated by canopy closure and soil temperature in an irrigated soybean field. Phytopathology. https://doi.org/10.1094/PDIS-11-17-1821-RE.
  4. Willbur, J.F., Mitchell, P.D., Fall, M.L., Byrne, A.M., Chapman, S.A., Floyd, C.M., Bradley, C.A., Ames, K.A., Chilvers, M.I., Kleczewski, N.M., Malvick, D.K., Mueller, B.D., Mueller, D.S., Kabbage, M., Conley, S.P., and Smith, D.L. 2019. Meta-analytic and economic approaches for evaluation of pesticide impact on Sclerotinia stem rot control and soybean yield in the North Central U.S. Phytopathology. https://doi.org/10.1094/PHYTO-08-18-0289-R.

Insights on In-Season Corn Disease Management Decisions

Damon Smith, Extension Field Crops Pathologist, Department of Plant Pathology, University of Wisconsin-Madison

Corn is approaching the V6-V8 growth stages in regions of Wisconsin. With this, comes many questions about applying fungicide to control disease and preserve yield. What diseases are out there? What disease(s) should I focus on in-season? When should I spray? What should I spray? On top of these questions, we are also confronted with corn prices, which are less than ideal and create tight profit margins. So what should we consider for in-season disease management? Lets consider the diseases first, then the management decisions.

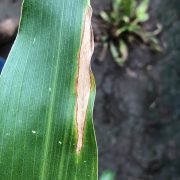
Figure 1. NCLB Lesions on a corn leaf

Northern Corn Leaf Blight (NCLB): The most diagnostic symptom of NCLB is the long, slender, cigar-shaped, gray-green to tan lesions that develop on leaves (Fig. 1).  Disease often begins on the lower leaves and works it way to the top leaves.  This disease is favored by cool, wet, rainy weather. Higher levels of disease might be expected in fields with a previous history of NCLB and/or fields that have been in continuous and no-till corn production. The pathogen over-winters in corn residue, therefore, the more residue on the soil surface the higher the risk for NCLB.  Management should focus on using resistant hybrids and residue management.  In-season management is available in the form of several fungicides that are labeled for NCLB. However, these fungicides should be applied at the early onset of the disease and only if the epidemic is expected to get worse.

While I hate talking about threshold levels for managing disease, it can be helpful in your decision making process to know what might be severe. While scouting look in the lower portion of the canopy. If some symptoms are present in the lower canopy, make a visual estimation of how frequent (percentage of plants with lesions) NCLB is in a particular area and how severe (how much leaf area is covered by NCLB lesions.  The lower leaves aren’t responsible for much yield accumulation in corn, but spores produced in NCLB lesions on these leaves can be splashed up to the ear leaves where disease can be very impactful. So by scouting the lower canopy and getting an idea of how much disease is present, you can “predict” what might happen later on the ear-leaves to make an informed spray decision.

Figure 2: A computer simulation of 5% NCLB severity on a corn leaf.

The other consideration you should make while scouting is the resistance rating that the hybrid has for NCLB. If it is rated as resistant, then NCLB severity might not be predicted to get very severe, while in  a susceptible hybrid, NCLB might be present on 50% or more of plants at high severity levels. Note however, that even if a hybrid is rated as resistant, it can still get some disease. Resistance isn’t immunity! If NCLB is present on on at least half the plants and severity is at least 5-10% and weather is forecast to be rainy and cool, a fungicide application will likely be needed to manage the disease. So what does 5% leaf severity look like? Figure 2 is a computer generated image that shows 5% of the corn leaf with NCLB lesions. You can use this image to train your brain to visually estimate how severe the disease might be on a particular leaf. As for fungicide choice and timing, I consider that further below.

Figure 3. Gray Leaf Spot lesions on a corn leaf.

Gray Leaf Spot (GLS): Gray leaf spot typically starts as small blocky or jagged, light tan spots. These can expand to become long, narrow, rectangular lesions (Fig. 3) that may have yellow or orange halos around them. Gray leaf spot is typically worse when temperatures are warm and humidity is frequently above 90%. Thus, in Wisconsin, this disease is generally more frequent in the southern and southeastern portion of the state. Conditions that favor GLS often do not favor NCLB. The GLS pathogen and NCLB pathogen have different temperature requirements. Yield loss from GLS will be the greatest if lesions develop on the ear-leaves right before and right after tasseling. Like NCLB, hybrids rated as susceptible will generally suffer greater yield reductions due to gray leaf spot. Management of GLS should focus on choosing hybrids with excellent resistance and managing corn residue. Corn residue allows the pathogen to overwinter.

Like NCLB, fungicides can also be used to manage gray leaf spot. However, these should be applied as preventative applications. Thus using the same rule of thumb to make a spray decision for GLS, as for NCLB, can help you make the decision to spray fungicide. As for fungicide choice and timing, I will also consider that further below.

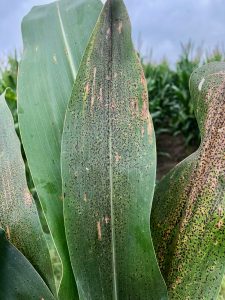
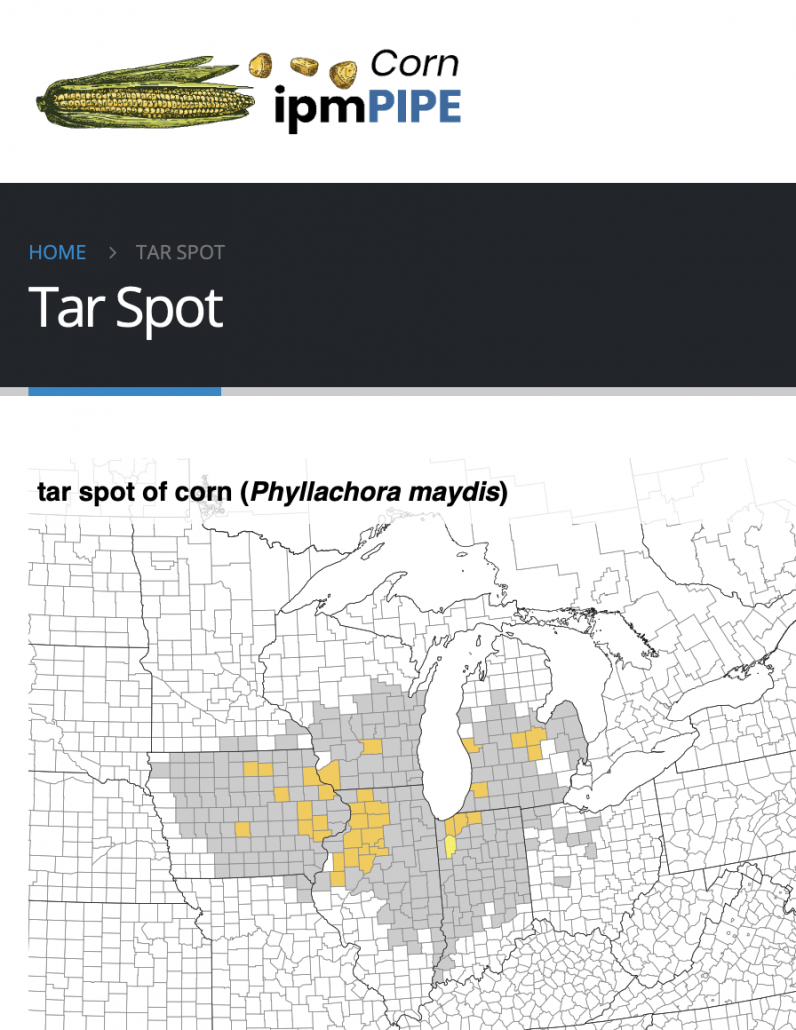
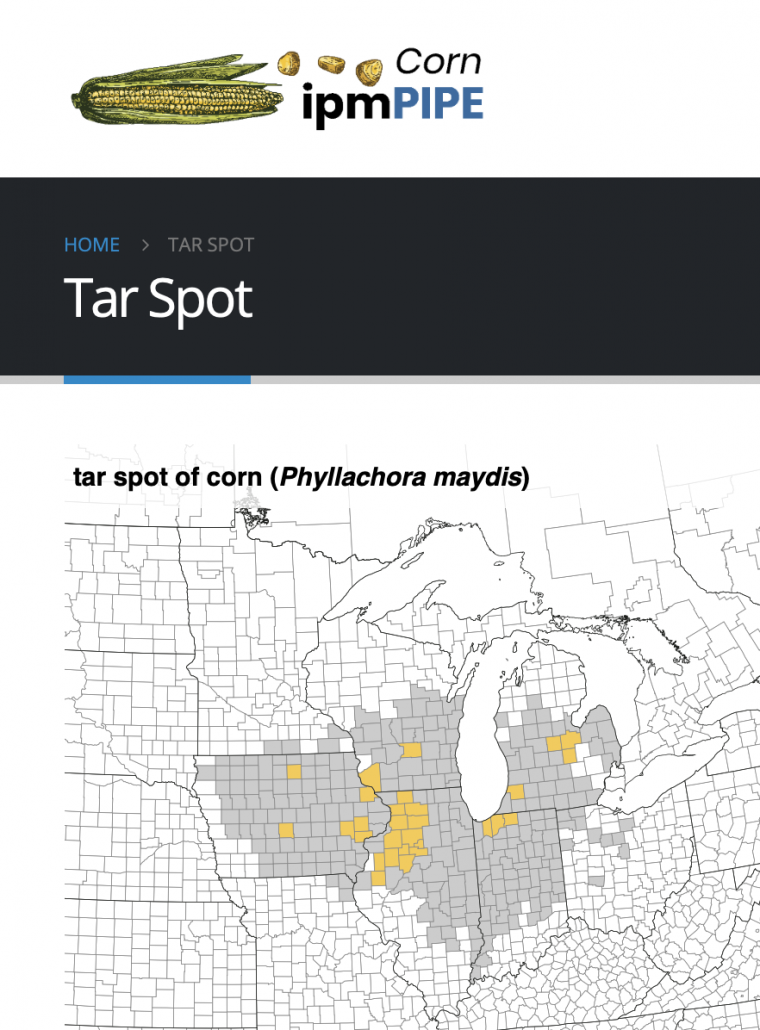
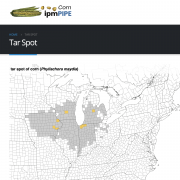
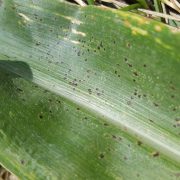
Figure 4. Tar Spot Signs and Symptoms on Corn Leaves

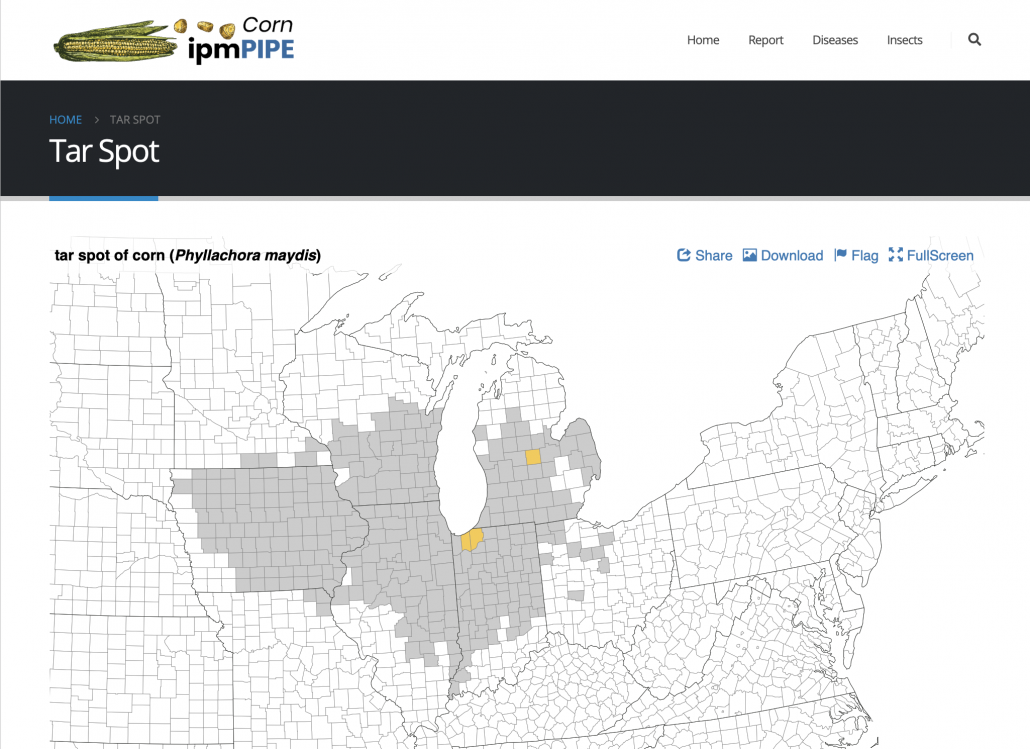
Tar Spot: Tar spot is favored by cool conditions (60-70 F) and high relative humidity (averages above 75%). Over the last several seasons the tar spot pathogen, Phyllachora maydis, has been able to cause yield reductions in parts of the Midwest by itself. There seems to be no need for a second fungus, Monographella maydis to be present to cause “fisheye” symptoms along with severe necrosis and early dry down. In addition, work done in the Midwest shows that the tar spot fungus can overwinter on corn residue from the previous season. So like with NCLB and GLS fields with high levels of infested residue might be more prone to infection by the tar spot fungus.

Not a lot is known about hybrid resistance to tar spot. Losses as high as 50-60 bushels per acre have been recorded on some hybrids, while others in the same field were only marginally affect. Partial resistance might be present in Midwest on certain corn hybrids. However work is ongoing to understand which hybrids those might be. Fungicide applications have been shown to reduce tar spot levels. However, timing of application must coincide with disease onset and product choice is important. Mixed-mode-of action fungicides have been the most consistent in efficacy over the past several seasons (more on that below). More information on tar spot can be found by CLICKING HERE.

Figure 5. Eyespot symptoms on a corn leaf.

Eyespot: Eyespot typically first develops as very small pen-tipped sized lesions that appear water-soaked.  As the lesions mature they become larger (¼ inch in diameter) become tan in the center and have a yellow halo (Fig. 5).  Lesions can be numerous and spread from the lower leaves to upper leaves. In severe cases, lesions may grow together and can cause defoliation and/or yield reduction. Eyespot is also favored by cool, wet, and frequently rainy conditions.  No-till and continuous corn production systems can also increase the risk for eyespot, as the pathogen is borne on corn residue on the soil surface.  Management should focus on the use of resistant hybrids and residue management.  In-season management is available in the form of fungicides. Severity has to reach high levels (>50%) before this disease begins to impact yield. I often have eyespot present in my corn trials each year as we plant into continuous corn and use no-till. However, we typically do not see yield reductions from this disease even in non-sprayed plots. When scouting, note the disease and keep track of the severity. Again, fungicides should be applied early in the epidemic and may not be cost effective for this disease alone.

What Disease(s) Should I Focus on In-Season? Based on the information above, the greatest emphasis for Wisconsin should be placed on controlling NCLB, GLS, and tar spot. Most hybrids planted in Wisconsin will be resistant to eyespot.

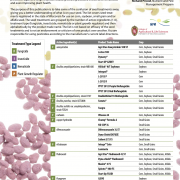
What Should I Spray, and When Should I Spray for Corn Foliar Diseases In Wisconsin? Fungicide should be used to preserve yield and reduce disease level. There is no silver bullet fungicide out there for all corn diseases. However, there are many products which work well on a range of diseases. The Corn Fungicide Efficacy table lists products that have been rigorously evaluated in university research trials across the country. You can see there are several products listed that perform well on NCLB, GLS, and tar spot. So obviously, if a disease is present and you are trying to control the disease, you might expect more return on your investment, compared to simply spraying fungicide and hoping that there might be a yield increase.

Paul et al. (2011) conducted research to investigate the return on investment (ROI) of using fungicide at low and elevated levels of disease. Data from 14 states between 2002 and 2009 were used in the analysis. They looked at 4 formulations of fungicide products across all of these trials. I won’t go into detail about all products, but will focus on one here, pyraclostrobin. This is the active ingredient in Headline® Fungicide. In all, 172 trials were evaluated in the analysis and Paul et al. found that on average there was a 4.08 bu/acre increase in corn grain yield when pyraclostrobin was used. So there does appear to be some increase in yield with the use of fungicide over not treating across a range of environments. But in our current market, will this average gain cover the fungicide application? Today’s corn future price for September has a bushel of corn at $3.31.

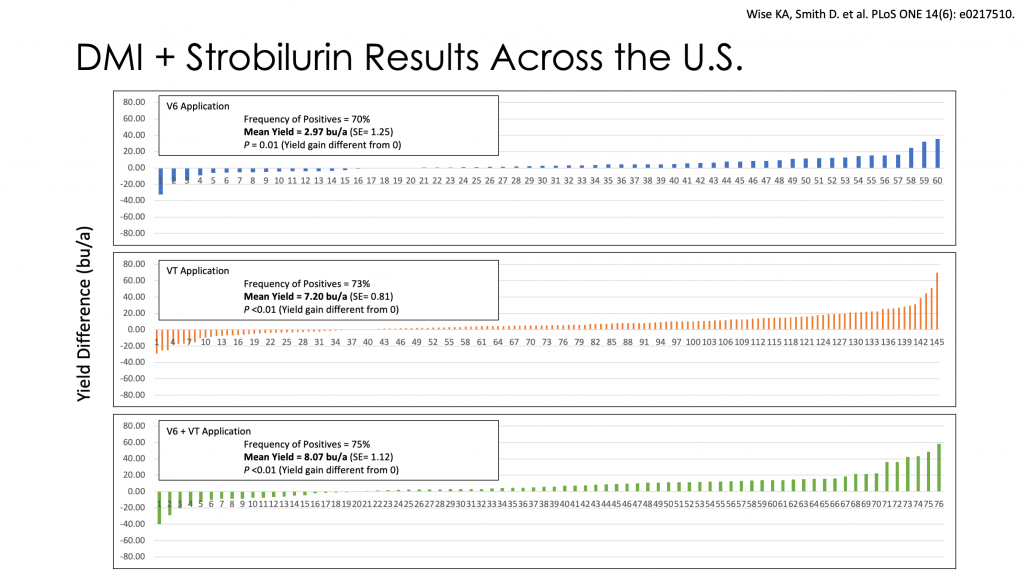
Figure 6. Average yield preservation of QoI+DMI fungicide applications over not-treating across the U.S. corn belt at the V6, Vt, and V6+VT application timing.

Let’s Take a Closer Look at Corn Fungicide Return on Investment (ROI): While most of the early work on fungicide use in corn has focused on Headline® Fungicide, much of the industry has transitioned to using multi-mode-of-action products. These would be products mostly containing strobilurin (QoI), triazole (DMI), and/or succinate dehydrogenase inhibitor (SDHI) fungicides in the same jug. Details about fungicides and fungicide mode of action can be found on the Fungicides for Field Crops Information Page. Products such as Headline AMP® or Quilt Xcel® would fall into the QoI + DMI category. These combination products have also been fairly consistent in response in my fungicide trials. You can find summaries of these trial results here. If we consider using Quit Xcel® at 10.5 fl oz or Headline AMP® at 10.0 fl oz, the list pricing of the product alone ranges from $15/acre (Quit Xcel®) to $22/acre (Headline AMP®). If the fungicide will be flown on with an aircraft, that cost will likely add nearly $15/acre to the application. Thus, fungicide plus application would range from $30/acre to $37/acre. If we can sell corn at $3.31 per bushel then we would need to preserve 9 bu/acre to nearly 11 bu/a in yield over not treating to break even! In a recent analysis of corn yield data where DMI+QOI products were applied at the tasseling period (VT) across the entire corn belt, the average yield preservation over not treating was 7.20 bu/a (Fig. 6). This average projection is short of the 9 bu/a minimum we would need in the scenario above. However, the probability of preserving yield considering an average of 7.20 bu/a preserved yield over not treating and $3.31/bu corn price is around 30% (Fig. 7). This means that if we apply Quit Xcel® at 10.5 fl oz or Headline AMP® at 10.0 fl oz aerially, we will only break even 30% of the time with corn priced at $3.31 per bushel. If we can sell our corn for a better price or make the applications cheaper, then the odds will improve, but probably not climb above 70% even under the best case scenario. We do know that in Wisconsin, the odds of breaking even do improve if NCLB or GLS are active and increasing during the tasseling period. Get out there and scout!

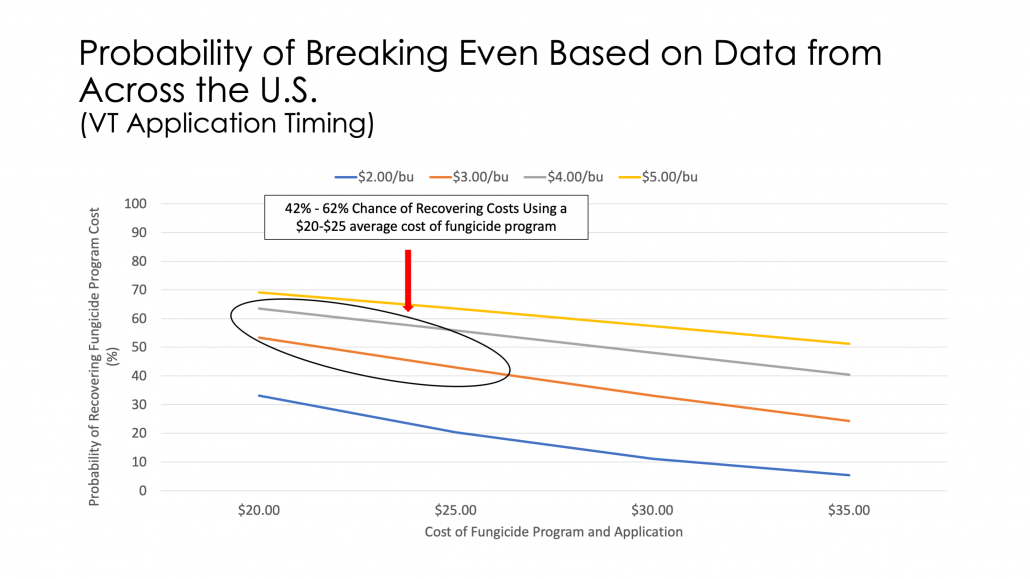
Figure 7. Probability of Breaking Even Based on Data from Across the U.S. (VT Application Timing)

So What About Fungicide Application Timing? We can investigate this questionover the U.S. corn belt using the same dataset. Applications focused on an early (V6) timing, a VT-R2 timing, or a combination of V6 plus a VT-R2 application. Let’s again focus on the QoI+DMI products. Based on observations across the corn belt the V6 timing averaged almost 3 bu/a of preserved yield over not treating (Fig. 6). The VT application resulted in nearly 7.2 bu/a in preserved yield, while the two-pass program only offered a little over 8 bu/a. Clearly the higher average yield preservation occurs using a single application of fungicide at the VT-R2 timing. Wisconsin data has been consistent with this observation. Thus it is recommended that a single application of fungicide be used around the VT-R2 growth stages, when NCLB or GLS are active and increasing on or near the ear leaves.

What About Silage Corn and Ear Rot? When it comes to ear rot control and reducing the accumulation of mycotoxins in grain or silage corn, fungicide application should be made when white silks are out. Spores of fungicide that generally cause mycotoxin issues in the grain portion of corn will infect the plant through silks. Thus, apply fungicides during silking or with 5-10 days after silking starts, can be beneficial. Note though that if the goal is to target mycotoxin production and reduce deoxynivalenol (DON) accumulation in the grain portion of the plant, products containing a DMI component should be used. Results where QoI + DMI products were used on silage corn can be found in our 2019 Fungicide Test Summary.

Finally, be aware that in some cases, application of fungicide in combination with nonionic surfactant (NIS) at growth stages between V8 and VT in hybrid field corn can result in a phenomenon known as arrested ear development. The damage is thought to be caused by the combination of NIS and fungicide and not by the fungicide alone. To learn more about this issue, you can CLICK HERE and download a fact sheet from Purdue Extension that covers the topic nicely. Considering that the best response out of a fungicide application seems to be between VT-R2, and the issues with fungicide plus NIS application between V8 and VT, I would suggest holding off for any fungicide applications until at least VT. If you want to spray earlier than VT, keep the NIS out of the tank!

Summary

As we approach the critical time to make decisions about in-season disease management on corn, it is important to consider all factors at play while trying to determine if a fungicide is right for your corn operation in 2020. Here is what you should consider:

1) Corn hybrid disease resistance score for NCLB and GLS (and perhaps tar spot too, if known) – Resistant hybrids may not have high levels of disease which impact yield.

2) Get out of the truck and SCOUT, SCOUT, SCOUT – Consider how much disease and the level of severity of disease present in the lower canopy prior to tassel.

3) Consider weather conditions prior to, and during, the VT-R2 growth stages – if weather is conducive for NCLB, GLS, and or tar spot then disease may continue to increase in corn and a fungicide application might be necessary. If it turns out to be hot and dry, disease development will stop and a fungicide application would not be needed.

4) Consider your costs to apply a fungicide and the price you can sell your corn grain – Will you preserve enough yield out of the fungicide application to cover its cost?

5) Hold off with making your fungicide application in Wisconsin until corn has reached the VT-R2 growth stages – The best foliar disease control and highest likelihood of a positive ROI will occur when fungicide is applied during this timing when high levels of disease are likely.

6) Be aware that every time you use a fungicide you are likely selecting for corn pathogen populations that will become resistant to a future fungicide application – Make sure your fungicide application is worth this long-term risk. See fact sheet A3878 below for more information.

Other Resources

Video: Disease Management in Low-Margin Years (fast forward to 10:00 for corn information)

Fact Sheet: A4137 – Grain Management Considerations in Low-Margin Years

Fact Sheet: A3878 – Fungicide Resistance Management in Corn, Soybeans, and Wheat in Wisconsin

References

Groves, C.L., Kleczewski, N.M., Telenko, D.E.P., Chilvers, M.I., and Smith, D.L. 2020. Phyllachora maydisascospore release and germination from overwintered corn residue. Plant Health Progress. https://doi.org/10.1094/PHP-10-19-0077-RS.

Munkvold, G.P. and White, D.G., editors. 2016. Compendium of Corn Diseases, Fourth Edition. APS Press.

Paul, P. A., Madden, L. V., Bradley, C. A., Robertson, A. E., Munkvold, G. P., Shaner, G., Wise, K. A., Malvick, D. K., Allen, T. W., Grybauskas, A., Vincelli, P., and Esker, P. 2011. Meta-analysis of yield response of hybrid field corn to foliar fungicides in the U.S. Corn Belt. Phytopathology 101:1122-1132.

Wise, K., Mueller, D., Sisson, A., Smith, D., Bradley, and Robertson, A., editors. 2016. A Farmer’s Guide to Corn Diseases. APS Press.

Wise, K.A. and Smith, D.L., Freije, A., Mueller, D.S., Kandel, Y., Allen, T., Bradley, C.A., Byamukama, E., Chilvers, M., Faske, T., Friskop, A., Hollier, C., Jackson-Ziems, Kelly, H., Kemerait, B., Price, P., Robertson, A., and Tenuta, A. 2019. Meta-analysis of yield response of foliar fungicide-treated hybrid corn in the United States and Ontario, Canada. PLoS ONE 14(6): e0217510. https://doi.org/ 10.1371/journal.pone.0217510.

Fungicide For Field Crops Information Page Updated

Damon Smith, Extension Field Crops Pathologist, Department of Plant Pathology, University of Wisconsin-Madison


The Fungicide for Field Crops Information webpage on the Badger CropDoc website has now been updated! The update includes links to the latest fungicide efficacy tables from the Crop Protection Network as well as several updated fact sheets from UW Integrated Pest and Crop Management Program. Many fungicide application decisions will be made over the next month or so. Even if you are already familiar with fungicides and how they work, a little refresher might be helpful as you make product and application decisions. If you aren’t familiar with fungicides or how to use on field crops, this page covers the basics with lots of useful information.