Time to Think About White Mold Management in Soybeans in Wisconsin

Damon Smith, Extension Field Crops Pathologist, Department of Plant Pathology, University of Wisconsin-Madison

Shawn Conley, Extension Soybean and Small Grains Agronomist, Department of Agronomy, University of Wisconsin-Madison

Roger Schmidt, Nutrient and Pest Management Program, University of Wisconsin-Madison

Paul Mitchell, Extension Economist, Agricultural and Applied Economics, University of Wisconsin-Madison

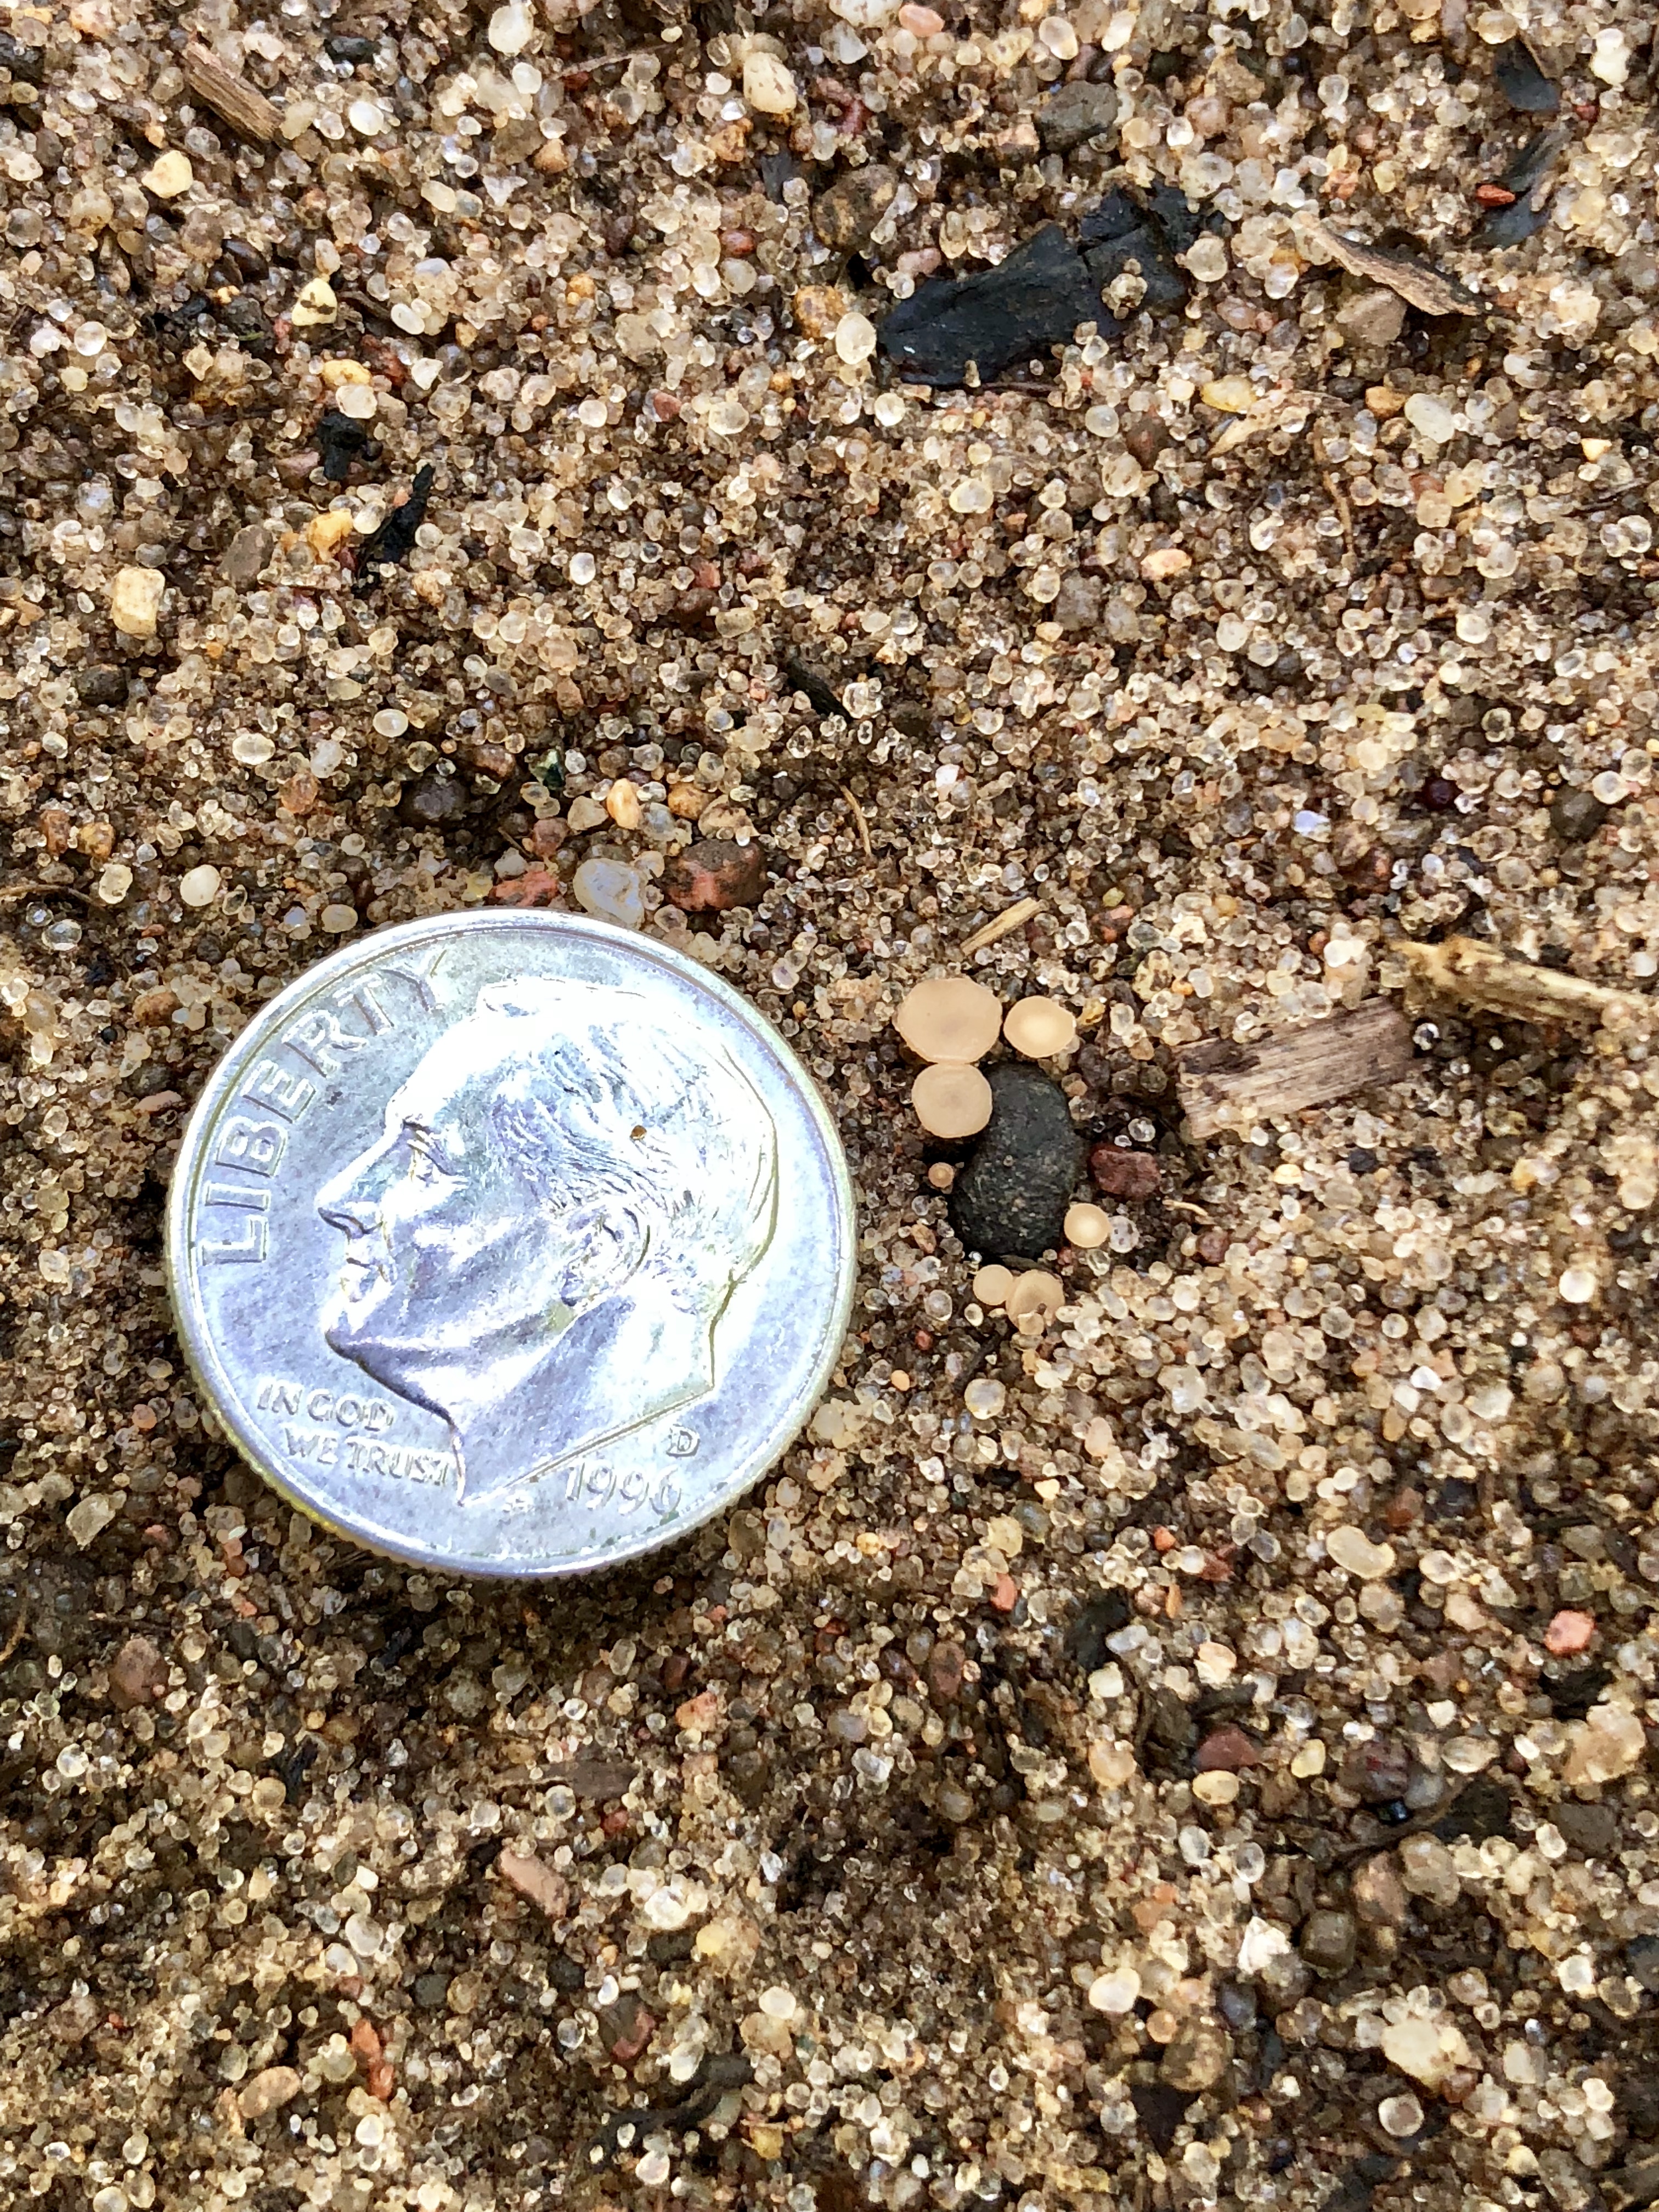
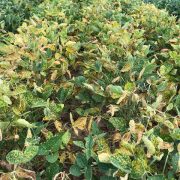
Figure 1. Apothecia, small mushroom-like structures of the white mold fungus that give rise to spores, which infect soybean flowers

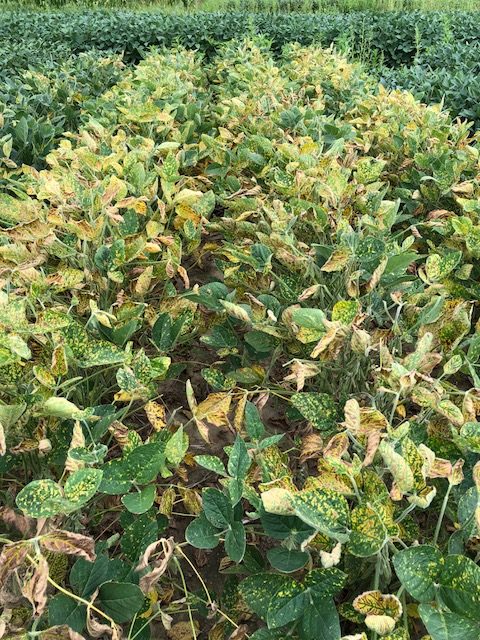
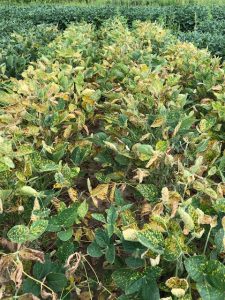
In Wisconsin, the first week of July brings us a heightened awareness of white mold in soybeans, and its management. Late planting in 2019, coupled with cool, wet conditions, meant that there were some areas significantly affected by white mold last season. These conditions led to susceptible bloom time lining up directly with weather conducive for the fungus.

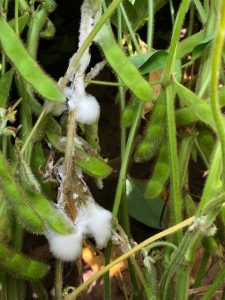
Remember that the white mold fungus infects soybeans through open and senescing flowers, by spores that are born from small mushroom-like structures called apothecia (Fig. 1). Remember that if the bloom period gets extended due to cool weather, this can lead to an extended window for infection by the fungus.Often cool weather is a double whammy as it is good for the white mold fungus and slows down soybean crop development, thereby extending bloom.

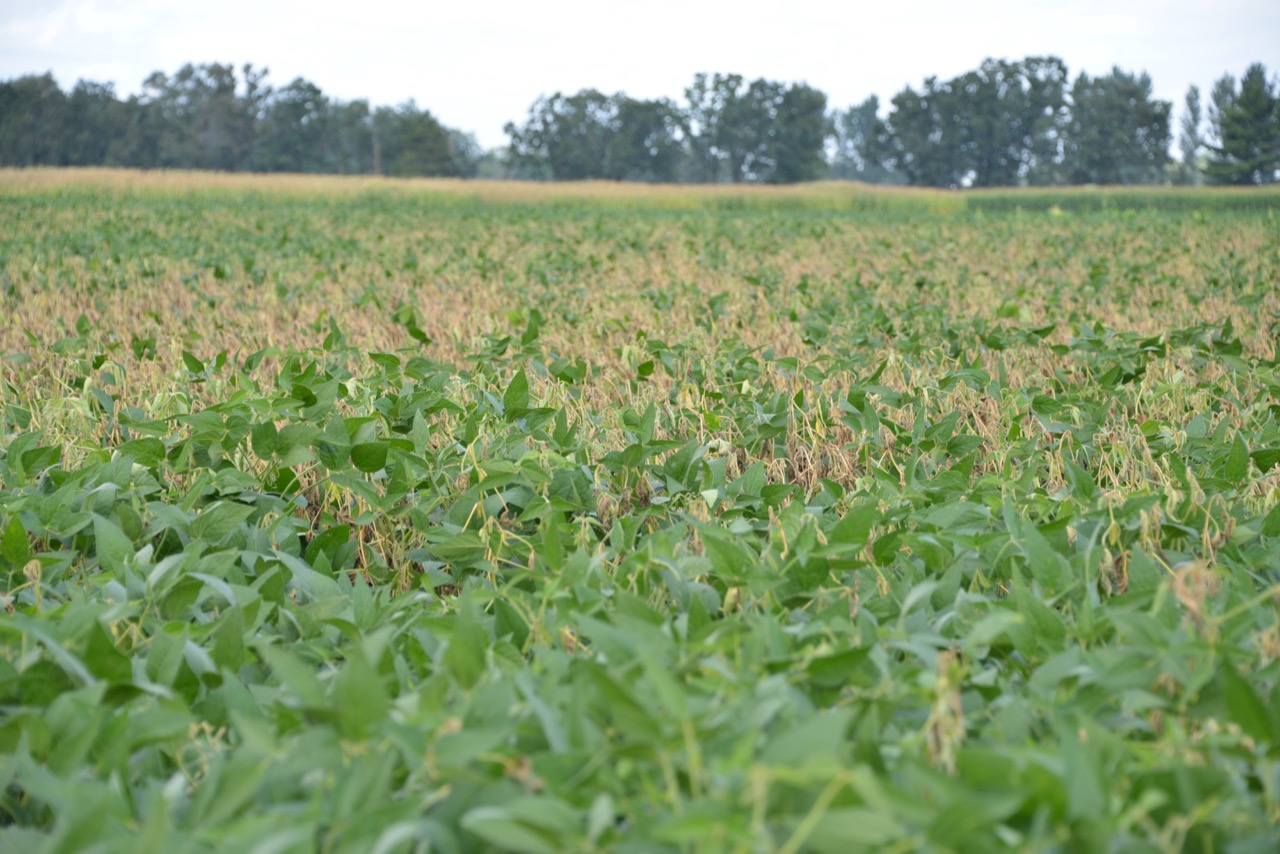
While conditions have been hot and dry in parts of the state, other portions have seen wetter conditions. The white mold situation can change rapidly based on weather, thus anticipating favorable conditions for white mold, can help you protect your soybean crop.

Predicting White Mold

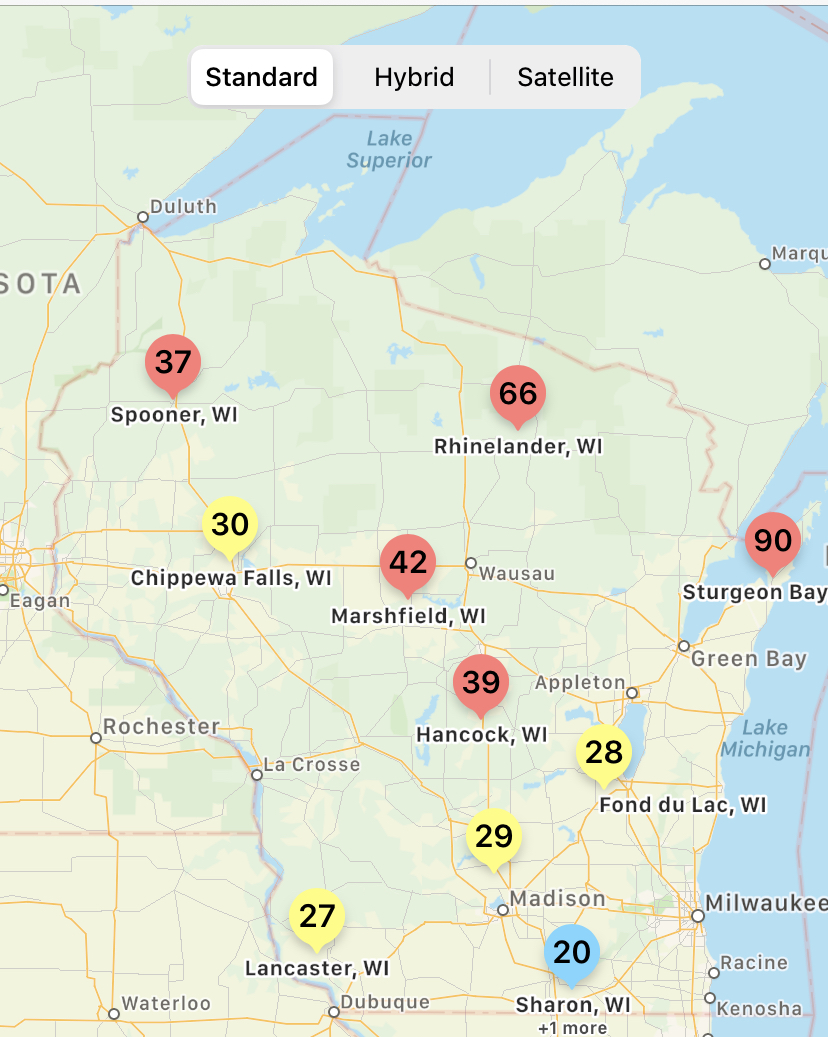
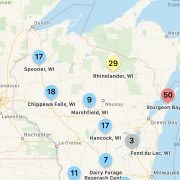
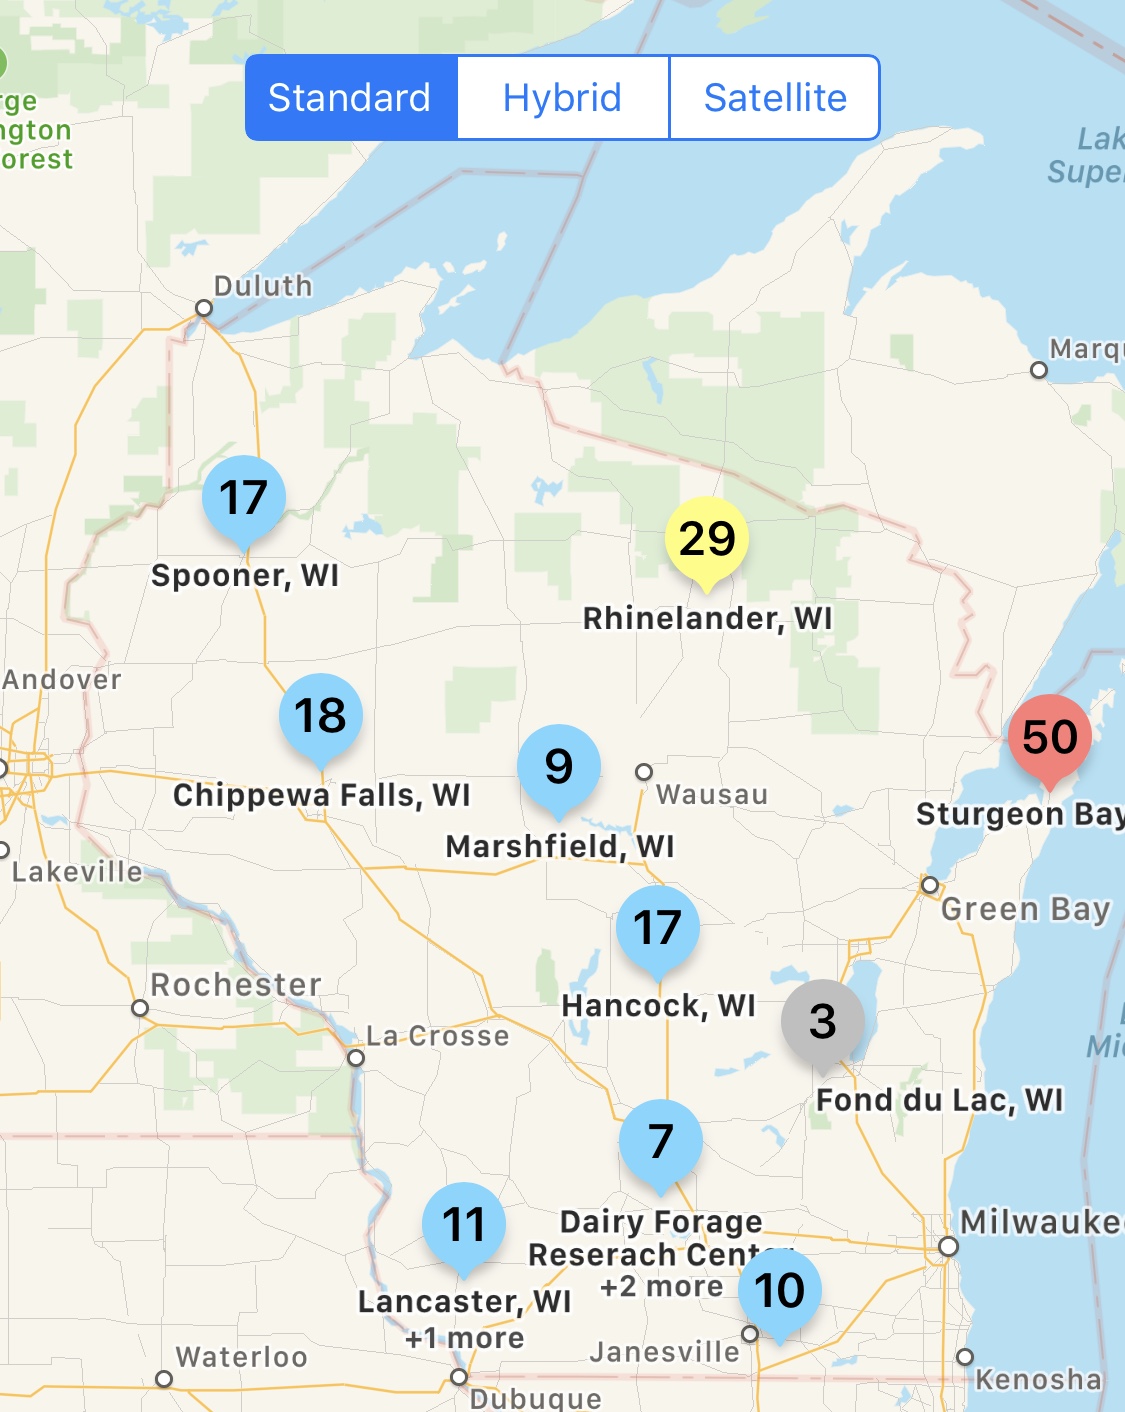
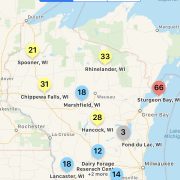
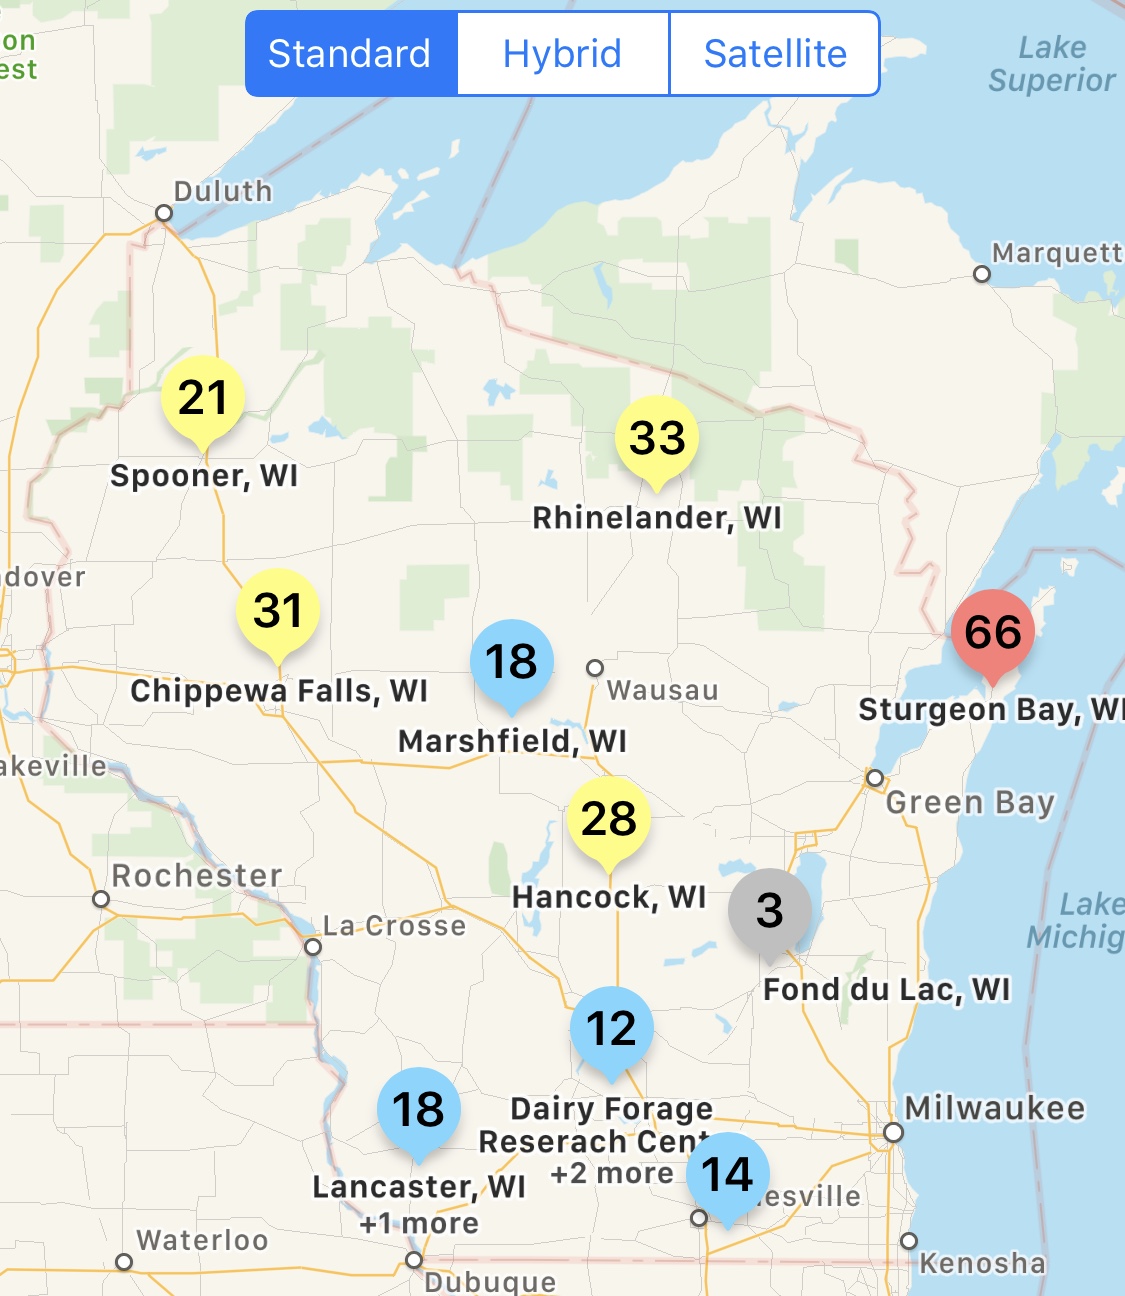
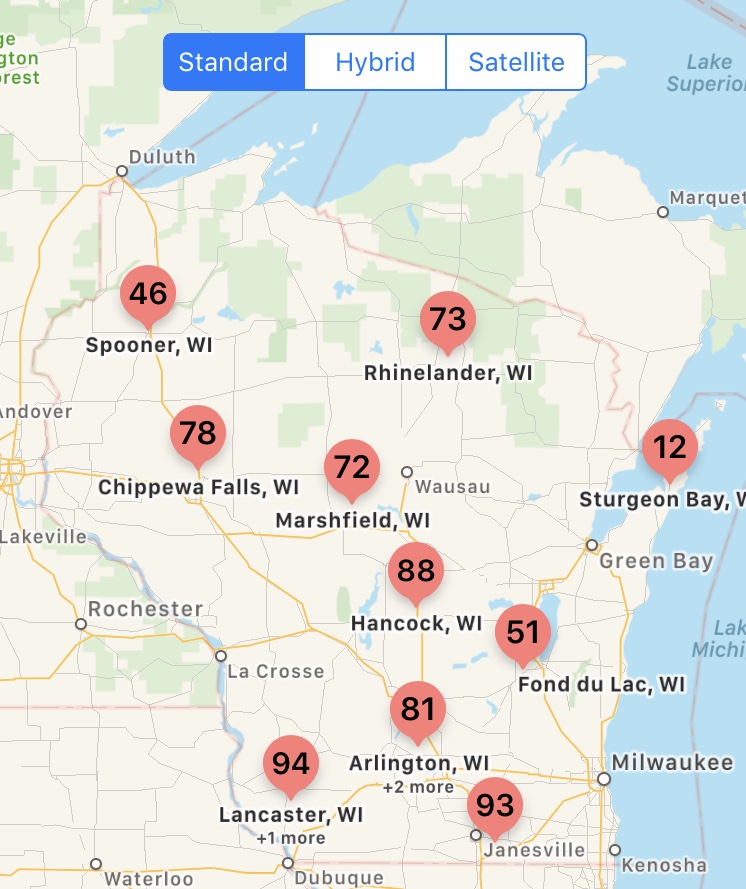
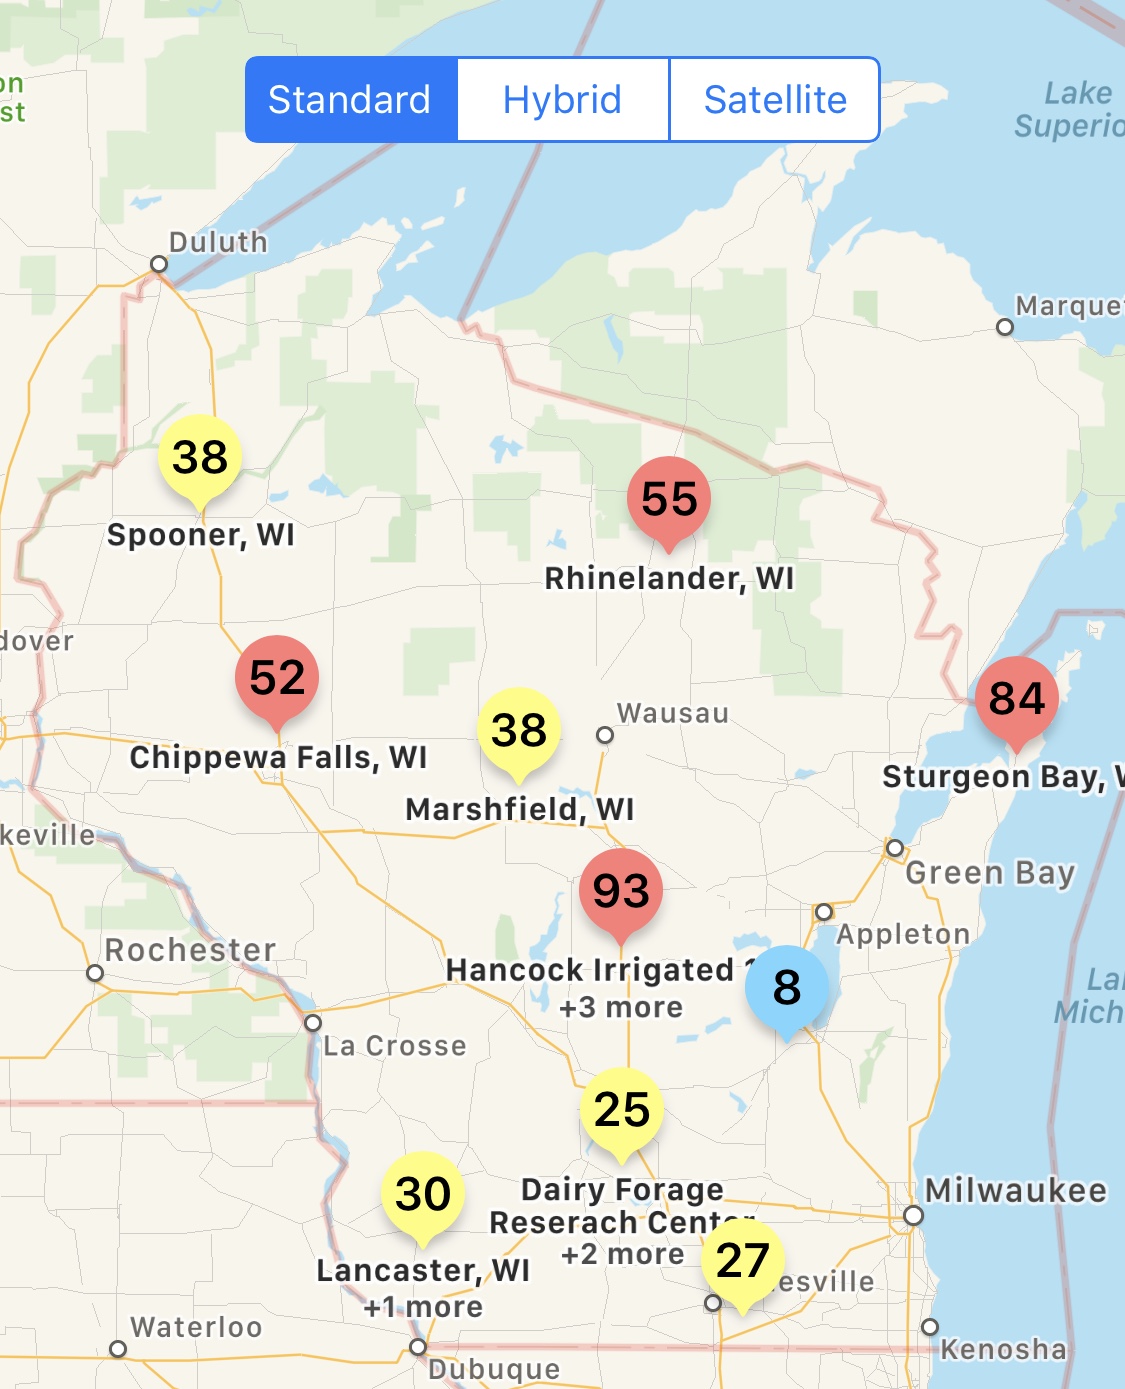
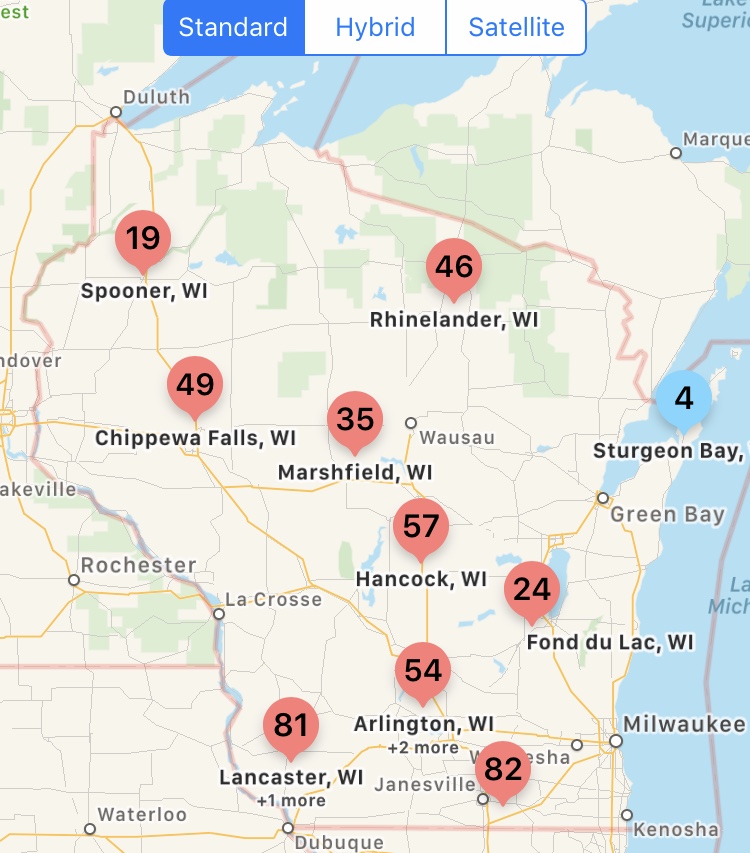
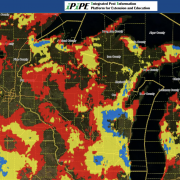
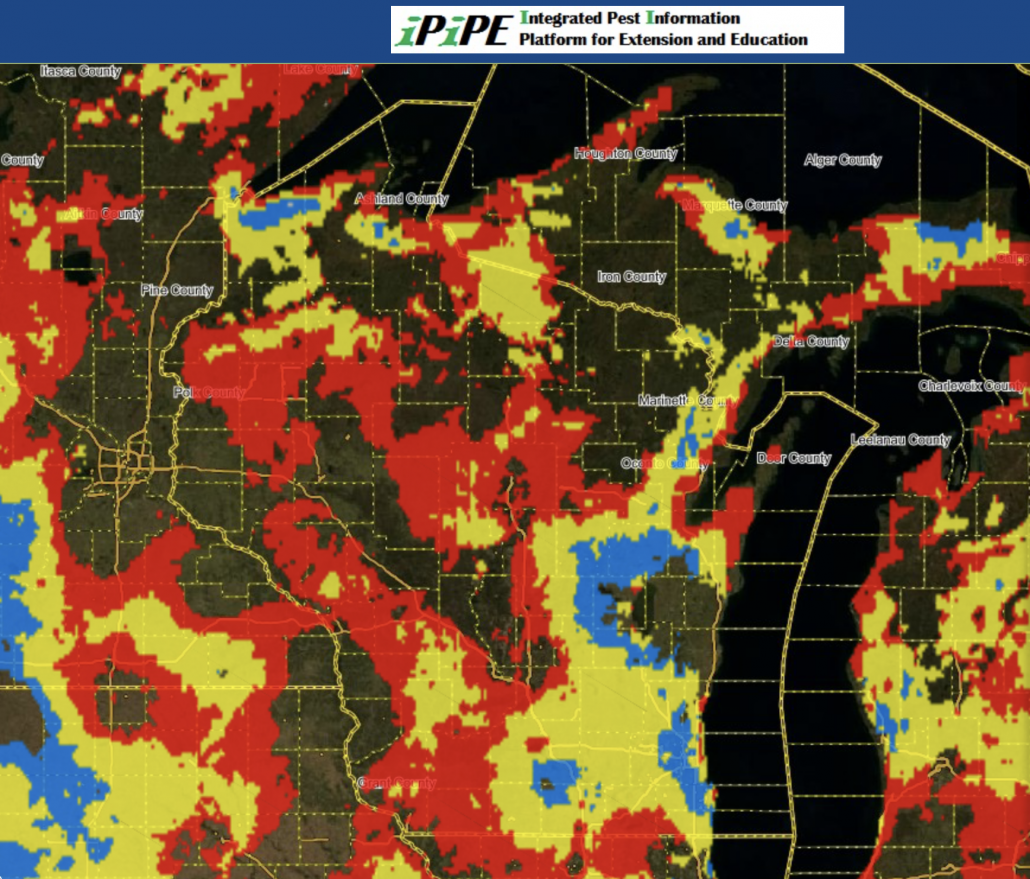
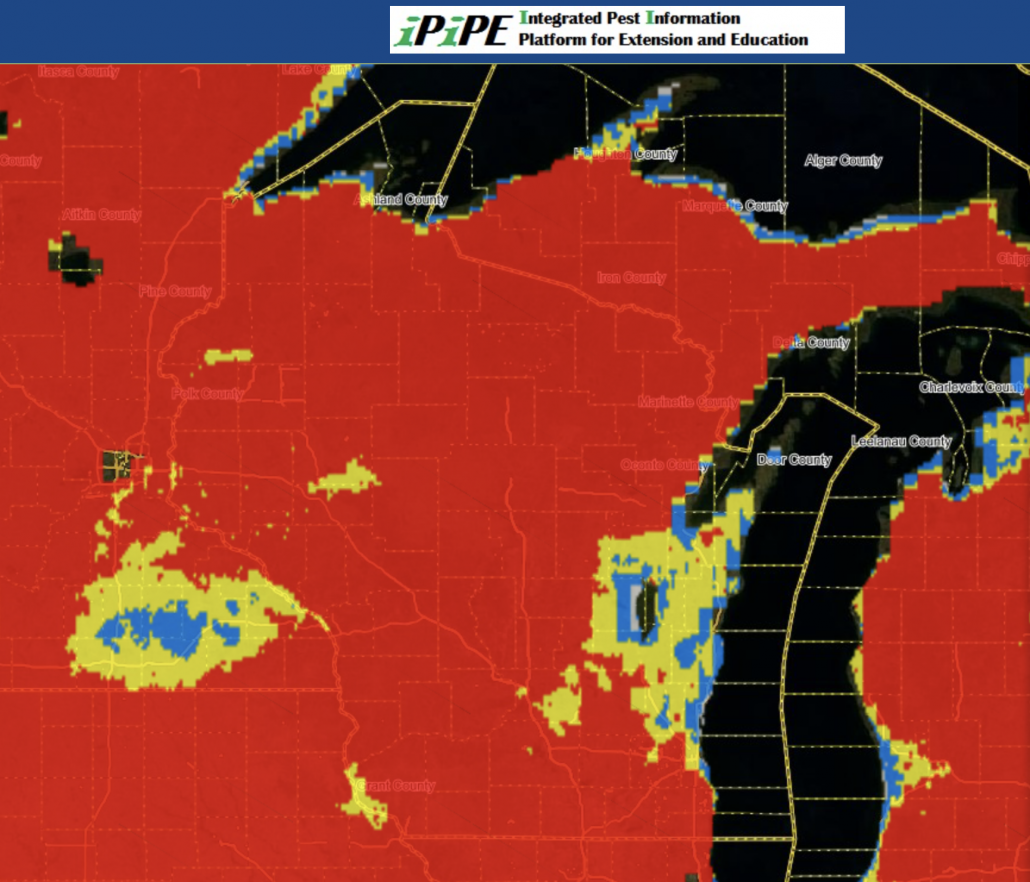
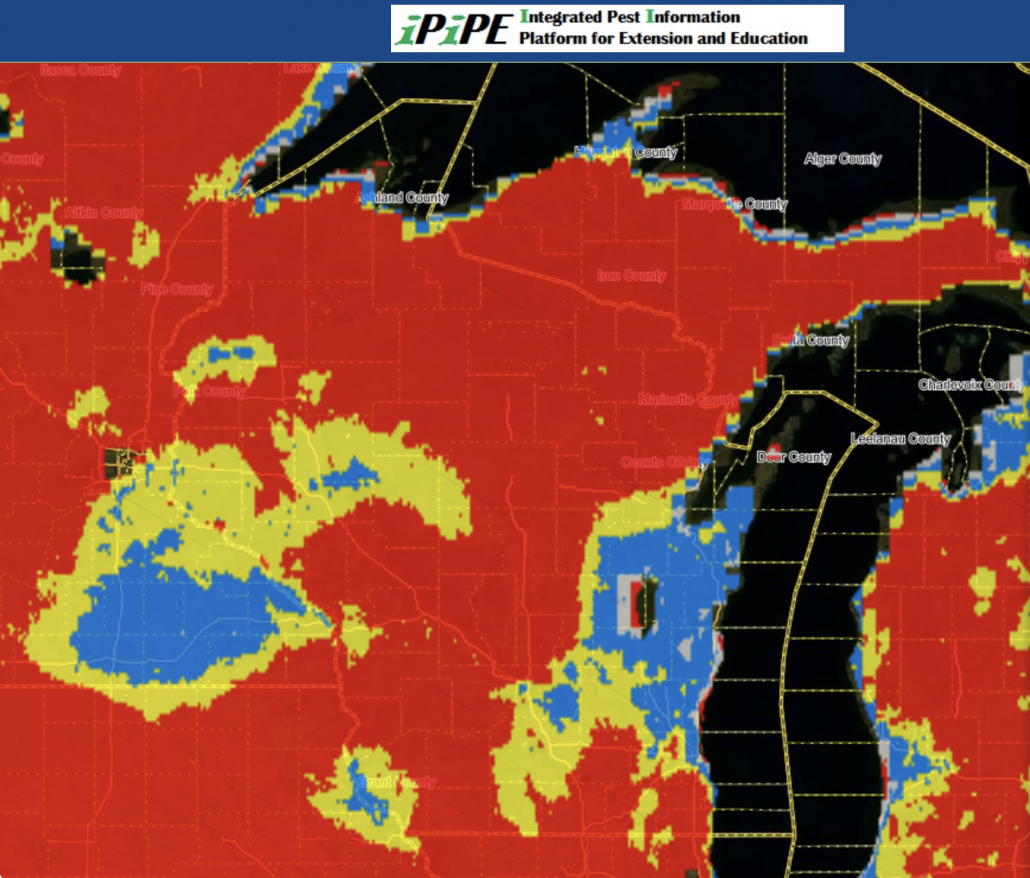
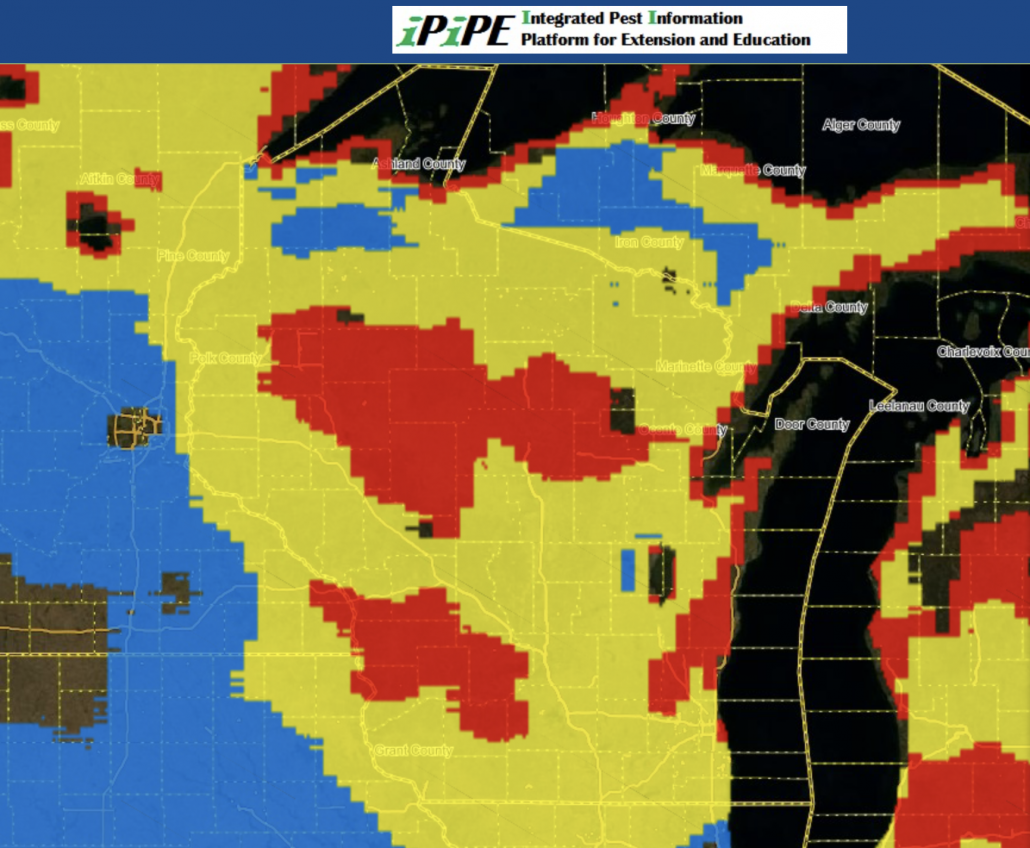
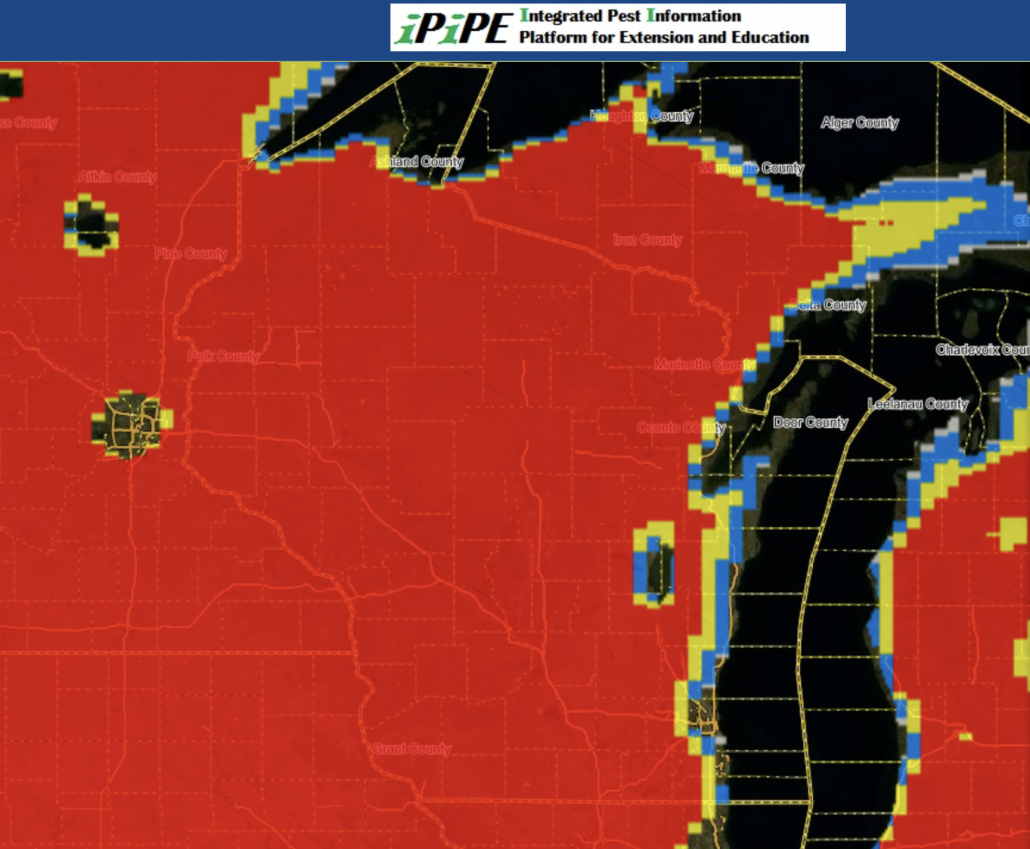
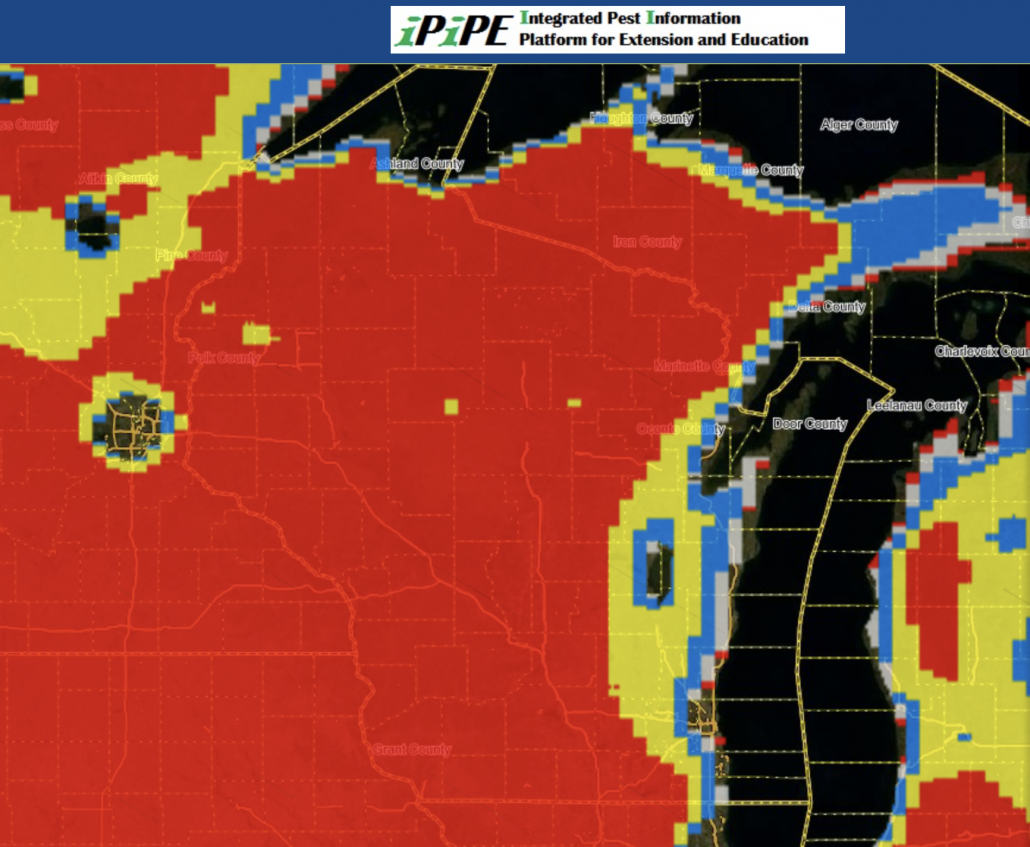
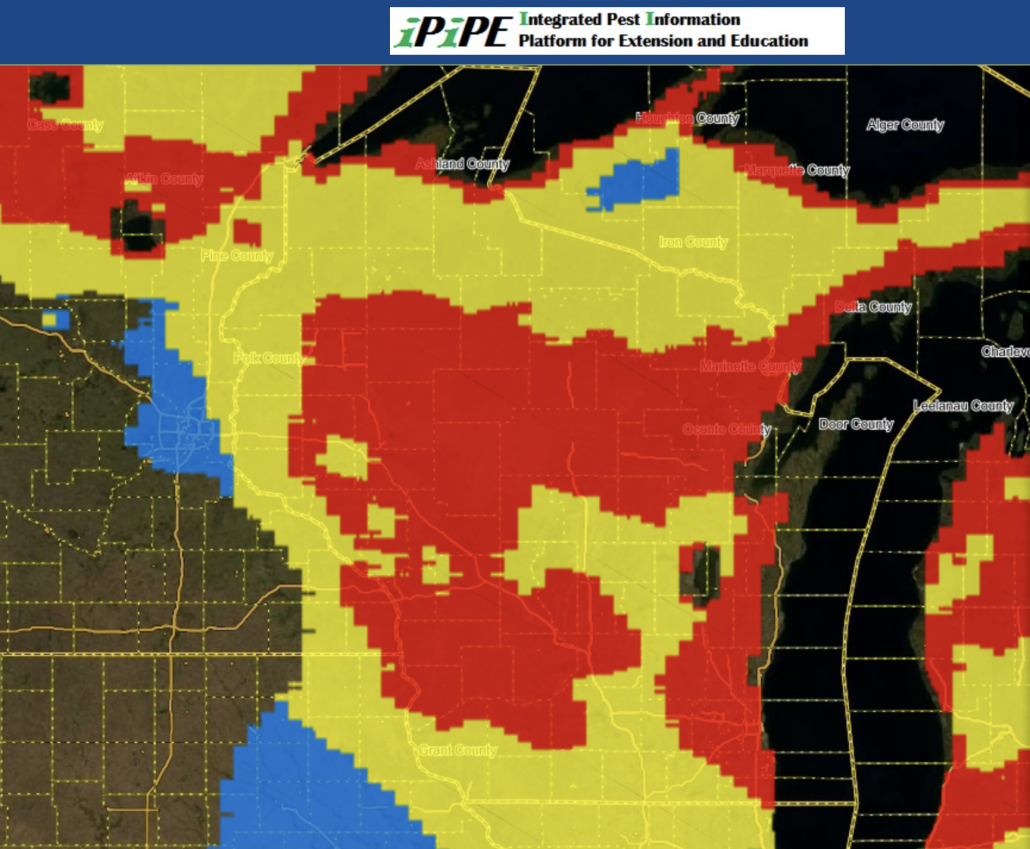
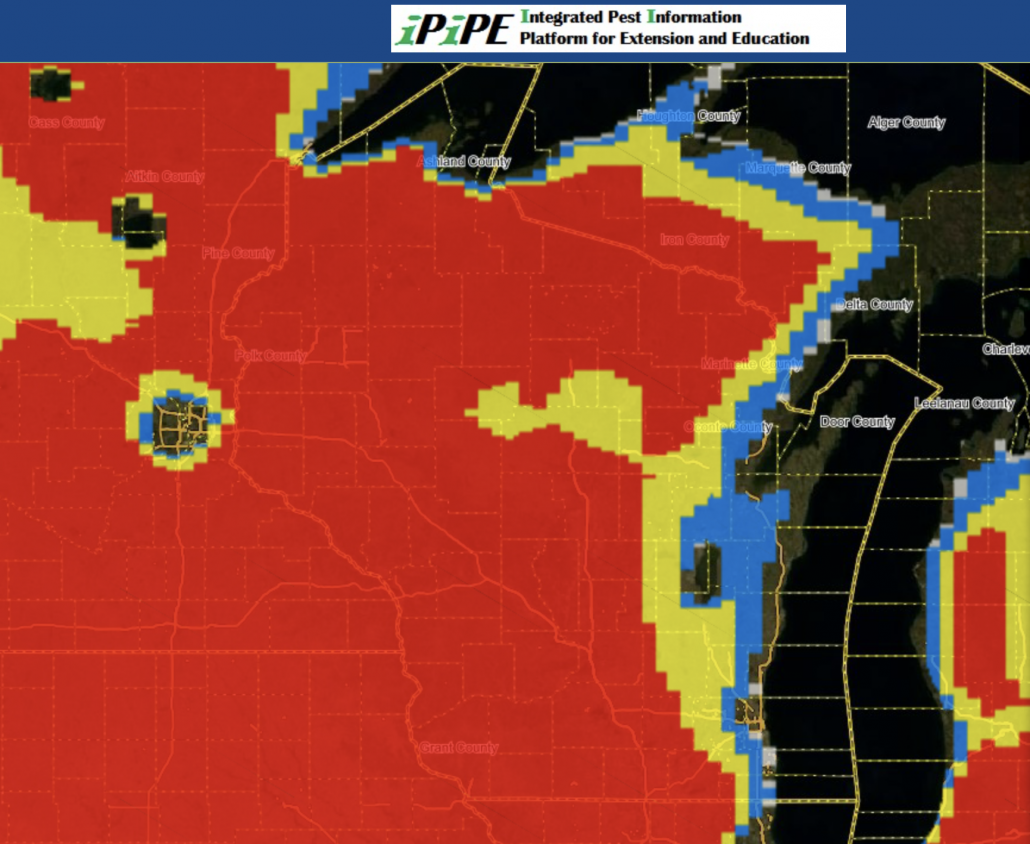
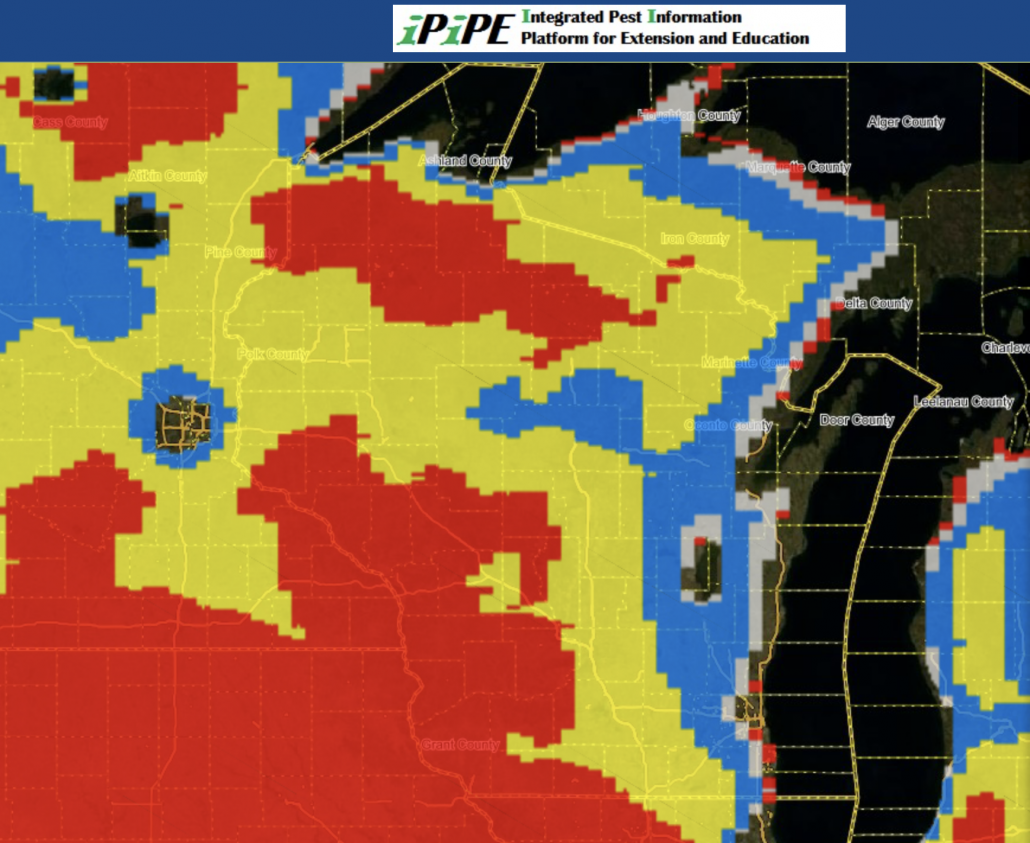
Figure 2. Sporecaster predictions for selected non-irrigated locations in Wisconsin for July 3, 2020.

The flowering growth stages are a critical time to manage white mold in-season. You can view a fact sheet and video on the subject. As you probably know, timing in-season fungicide sprays at the correct time during the soybean bloom period can be extremely difficult. To help solve this decision-making issue, models were developed at the University of Wisconsin-Madison in conjunction with Michigan State University and Iowa State University to identify at-risk regions which have been experiencing weather favorable for the development of white mold apothecia. These models predict when apothecia will be present in the field using combinations of 30-day averages of maximum temperature, relative humidity, and wind speed. Using virtually available weather data, predictions can be made in most soybean growing regions. To facilitate precise predictions and make the model user-friendly, we use Sporecaster smartphone application for Android and iPhone.

The purpose of the smartphone app is to assist farmers in making early season management decisions for white mold in soybean. The best time to spray fungicides for white mold is during flowering (R1 and R3 growth stages) when apothecia are present on the soil surface.

Sporecaster uses university research to turn a few simple taps on a smartphone screen into an instant forecast of the risk of apothecia being present in a soybean field, which helps growers predict the best timing for white mold treatment during the flowering period.

University research has indicated that the appearance of apothecia can be predicted using weather data and a threshold of percent soybean canopy row closure in a field. Based on these predictions and crop phenology, site-specific risk values are generated for three scenarios (non-irrigated soybeans, soybeans planted on 15″ row-spacing and irrigated, or soybeans planted on 30″ row-spacing and irrigated). Though not specifically tested we would expect row-spacings of 22 inches or less to have a similar probability response to fungicide as the 15 inch row-spacing.

The Sclerotinia apothecial models that underlie the Sporecaster prediction tool have undergone significant validation in both small test plots and in commercial production fields. In 2017, efficacy trials were conducted at agricultural research stations in Iowa, Michigan, and Wisconsin to identify fungicide application programs and thresholds for model implementation. Additionally, apothecial scouting and disease monitoring were conducted in a total of 60 commercial farmer fields in Michigan, Nebraska, and Wisconsin between 2016 and 2017 to evaluate model accuracy across the growing region. Across all irrigated and non-irrigated locations predictions during the soybean flowering period (R1 to early R4 growth stages) were found to explain end-of-season disease observations with an accuracy of 81.8% using the established probability thresholds now programmed in the app. We have made additional improvements for 2020, to further refine accuracy. So if you have used Sporecaster before, you might want to watch the embedded video above to learn about the changes that were made for 2020 and how to best use Sporecaster. If you want to learn more about the science of Sporecaster, check out the embedded video below.

Not only can users run predictions of risk during the soybean bloom period for any field, you can also set up visual maps to look at multiple sites simultaneously. An example for the state of Wisconsin can be found in figure 2, which represents risk for July 3, 2020 for non-irrigated soybeans. Currently, if soybeans are flowering, risk is moderate to low in the southern third of Wisconsin for non-irrigated soybeans. And higher for flowering soybeans in the northern portions of the state. Check back to this blog regularly as I will post maps like these with interpretation of risk for Wisconsin as we move through the season.

What to Spray for White Mold?

If you have decided to spray soybeans for white mold, what are the best products to use? Over the last several years we have run numerous fungicide efficacy trials in Wisconsin and in conjunction with researchers in other states. In Wisconsin, we have observed that Endura applied at 8 oz at the R1 growth stage performs well. We have also observed that the fungicide Aproach applied at 9 fl oz at R1 and again at R3 also performs comparably to the Endura treatment. Other fungicide options also include Omega and Proline. You can view results of past fungicide evaluations for Wisconsin by CLICKING HERE.If you would like to run tailored estimations of return on investment for various fungicide programs, you can use another smartphone application called Sporebuster.

What is Sporebuster?

When a fungicide application is needed to control white mold in soybeans, Sporebuster can help determine a profitable program. You enter your expected soybean price, expected yield, and treatment cost. Sporebuster instantly compares ten different treatment plans at once to determine average net gain and breakeven probability of each. You can mark, save and share by email, the best plans for your farming operation.

The purpose of Sporebuster is to assist soybean farmers in making a fungicide program decision that is profitable for their operation. Sporebuster is meant to complement Sporecaster. Once Sporecaster recommends a fungicide application, Sporebuster can be used to determine a profitable program.

Information that drives Sporebuster is based on research from 2009-2016 from across the upper Midwestern US. Statistical models were developed based on these data that included white mold pressure and yield response from fungicide for 10 common fungicide programs. Details about the research behind Sporebuster can be found by CLICKING HERE to download a PDF version of a research update on the subject.

Helpful Smartphone Application Links

Sporecaster

  1. Click here to download the Android version of Sporecaster. 
  2. Click here to download the iPhone version of Sporecaster.

Sporebuster

  1. Click here to download the Android version of Sporebuster.
  2. Click here to download the iPhone version of Sporebuster.
  3. Here is a video on how to use Sporebuster and interpret the output.

Other Resources

  1. To watch an in-depth video on white mold management, CLICK HERE.
  2. To find more information and download a fact sheet on white mold from the Crop Protection Network, CLICK HERE.

Scientific References

  1. Willbur, J.F., Fall, M.L., Blackwell, T., Bloomingdale, C.A., Byrne, A.M., Chapman, S.A., Holtz, D., Isard, S.A., Magarey, R.D., McCaghey, M., Mueller, B.D., Russo, J.M., Schlegel, J., Young, M., Chilvers, M.I., Mueller, D.S., and Smith, D.L. Weather-based models for assessing the risk of Sclerotinia sclerotiorum apothecial presence in soybean (Glycine max) fields. Plant Disease. https://doi.org/10.1094/PDIS-04-17-0504-RE
  2. Willbur, J.F.,Fall, M.L., Byrne, A.M., Chapman, S.A., McCaghey, M.M., Mueller, B.D., Schmidt, R., Chilvers, M.I., Mueller, D.S., Kabbage, M., Giesler, L.J., Conley, S.P., and Smith, D.L. Validating Sclerotinia sclerotiorumapothecial models to predict Sclerotinia stem rot in soybean (Glycine max) fields. Plant Disease. https://doi.org/10.1094/PDIS-02-18-0245-RE.
  3. Fall, M., Willbur, J., Smith, D.L., Byrne, A., and Chilvers, M. 2018. Spatiotemporal distribution pattern of Sclerotinia sclerotiorum apothecia is modulated by canopy closure and soil temperature in an irrigated soybean field. Phytopathology. https://doi.org/10.1094/PDIS-11-17-1821-RE.
  4. Willbur, J.F., Mitchell, P.D., Fall, M.L., Byrne, A.M., Chapman, S.A., Floyd, C.M., Bradley, C.A., Ames, K.A., Chilvers, M.I., Kleczewski, N.M., Malvick, D.K., Mueller, B.D., Mueller, D.S., Kabbage, M., Conley, S.P., and Smith, D.L. 2019. Meta-analytic and economic approaches for evaluation of pesticide impact on Sclerotinia stem rot control and soybean yield in the North Central U.S. Phytopathology. https://doi.org/10.1094/PHYTO-08-18-0289-R.

Sporecaster Smartphone App Updated for 2020

Damon Smith, Extension Field Crops Pathologist, Department of Plant Pathology, University of Wisconsin-Madison

Roger Schmidt, Nutrient and Pest Management Program, University of Wisconsin-Madison

The Sporecaster smartphone app for predicting white mold epidemics in soybean has been updated for 2020. The new version is now available for download, or has been updated on your phone if you have automatic updates turned on. Updates include modifications internally and also a change on the user interface. These modifications were made based on feedback from users and our own internal testing over the winter of 2019/2020.

The most substantial changes include modifications to how we handle weather internally. The modifications were made to improve accuracy of the prediction when using GPS-referenced weather data. We also added the ability for the user to now adjust the action threshold for each individual location. This can be done based on your prior knowledge of severity at that location or the amount of risk you feel comfortable with. If you don’t know how severe past epidemics have been, then we suggest leaving the action threshold at its default.

We have also assembled several short YouTube videos describing the changes made for 2020 and also a bit about the science behind the app. The new version (version 1.35) of the Sporecaster app can be downloaded for the iPhone on the App Store here and the Android version can be downloaded from Google Play here.

Check back to badgercropdoc.com often during the season as we will also provide white mold updates on risk and commentary. Also follow us on Twitter @badgercropdoc for the latest in-season updates for field crops in Wisconsin. Don’t forget to subscribe to the Wisconsin Crop Manager for valuable crop updates.

Soybean Disease Considerations As the 2019 Harvest Approaches

Damon L. Smith, Associate Professor and Extension Field Crops Pathology Specialist, University of Wisconsin-Madison

Shawn P. Conley, Professor and Extension Soybean and Small Grains Agronomy Specialist, University of Wisconsin-Madison 

As the days get shorter and the temperatures start to cool, soybean harvest is on everyone’s minds. As the crop is maturing and beginning the early stages of drydown, calls about diseases are starting to come in. In the southern third of the state most of the calls have centered on sudden death syndrome or SDS. To the north, most questions pertain to Sclerotinia stem rot or white mold. Below we will discuss SDS in some detail and provide a brief update on the white mold situation as well as elaborate on seed decay issues that we should pay attention to as we begin harvest.

Scout for Sudden Death Syndrome (SDS)

Figure 1. Symptoms of sudden death syndrome on soybeans

The first noticeable symptoms of SDS (Fig. 1) are chlorotic (i.e., yellow) blotches that form between the veins of soybean leaflets. These blotches expand into large, irregular, chlorotic patches (also between the veins), and this chlorotic tissue later dies and turns brown. Soon thereafter entire leaflets will die and shrivel. In severe cases, leaflets will drop off leaving the petioles attached. Taproots and below-ground portions of the stems of plants suffering from SDS, when split open, will exhibit a slightly tan to light brown discoloration of the vascular (i.e., water- conducting) tissue. The pith will remain white or cream-colored. In plants with advanced foliar symptoms of SDS, small, light blue patches will form on taproots and stems below the soil line. These patches are spore masses of the fungus that causes the disease.

Figure 2. Symptoms of BSR in soybean stems compared with a healthy soybean stem in the center.

Foliar symptoms of SDS can be confused with those of brown stem rot. However, in the case of brown stem rot (BSR), the pith of affected soybean plants will be brown (Fig. 2). In addition, roots and lower stems of plants suffering from BSR will not have light blue spore masses.

Once symptoms of SDS are evident, yield losses are inevitable. Yield losses can range from slight to 100%, depending on the soybean variety being grown, the plant growth stage at the time of infection and whether or not SCN is present in a field. If SDS occurs after reproductive stages (R5 or R6) impact on yield is usually less compared to the development of SDS at flowering, which can lead to substantial yield losses. When SCN is present, the combined damage from both diseases can be substantially more than the sum of the damage expected from the individual diseases.

SDS is caused by the soilborne fungus, Fusarium virguliforme (synonym: F. solani f. sp. glycines). F. virguliforme can overwinter freely in the soil, in crop residue, and in the cysts of SCN. The fungus infects soybean roots (by some reports as early as one week after crop emergence), and is generally restricted to roots as well as stems near the soil line. F. virguliforme does not invade leaves, flowers, pods or seeds, but does produce toxins in the roots that move to the leaves, causing SDS’s characteristic foliar symptoms.

SDS cannot be controlled once plants have been infected. Foliar fungicides have NO effect on the disease. Recently a new seed treatment has been identified that has efficacy against SDS. The active ingredient fluopyram can be found in the seed treatment iLeVo and is rated “very good” in multi-state trials. Other methods of control include using SDS-resistant varieties whenever possible in fields with a history of the disease; however, keep in mind that SDS-resistant varieties with maturity groups suitable for Wisconsin and other northern regions (groups I and II) can be limited. If SDS and SCN are both problems in the same field, planting an SCN-resistant soybean variety may also be beneficial in managing SDS. Do not delay planting soybeans to avoid symptoms of SDS.  In Wisconsin, it has been demonstrated that the benefits to yield when planting early outweigh the benefits of reduced SDS symptoms if planting is delayed. Improve soil drainage by using tillage practices that reduce compaction problems. Rotation, while useful in managing other soybean diseases, does not appear to significantly reduce the severity of SDS. Even after several years of continuous production of corn, F. virguliforme populations typically are not reduced substantially. Research from Iowa State University has shown that corn (especially corn kernels) can harbor the SDS pathogen.

For more information CLICK HERE to download a full color fact sheet on SDS. A short video on SDS can also be viewed by CLICKING HERE.

Know Where White Mold is in 2019

Figure 3. White Mold in a Soybean Field

Symptoms of white mold (Fig. 3) are becoming pretty apparent in some parts of central and northern Wisconsin. White fluffy growth (mycelium) is readily evident over the last week while weather has been humid and wet. Incidence in the northern half of the state is high in some fields. Fields in the northeast and northwest corridors of the state seem to be hardest hit, but severity is highly variable from one field to the next.  This is likely due to a combination of variety and micro-environments that can influence the disease. Most of the soybean crop is at the R6 growth stage, with some earlier maturing fields are almost through R7 or have made it to R8. Now the question is how much soybean yield might I lose from white mold?

Research has demonstrated that for every 10% increase in the number of plants that are infected with white mold at the R7 growth stage, you can expect between 2 to 5 bushels of yield loss. Thus, fields with low levels (say 3% incidence) will likely experience no detectable yield loss while fields with 20% incidence could lose as much as 10 bushels per acre.

What should I do if I see white mold in my soybean field now?

The first step is to get out and survey your fields for white mold. It is a good idea to determine how much white mold you have in your fields, so you can make some educated harvest decisions. One way to move white mold from one field to the next is via combines. You could clean your combine between each field, but this can be time consuming. So by determining which fields have no white mold and which fields have the most white mold, you can develop a logical harvest order by beginning your harvest on fields with no white mold and working your way to the heavily infested fields. This will help reduce spread of the white mold fungus to fields that aren’t infested. You can also make some decisions on your rotation plan and future soybean variety choices based on these late season observations.

If you would like to learn more about white mold and management of this disease, CLICK HERE to download a fact sheet from the crop protection network. You can also watch a short video about white mold by CLICKING HERE.

Watch for Phomopsis Seed Decay at Harvest

Figure 4. Severe Phomopsis seed decay. Photo Credit: Craig Grau, University of Wisconsin-Madison.

If you remember the 2018 harvest season, you are probably having nightmares right now. Extended rainy periods in October significantly delayed harvest and subjected the standing soybean crop to significant seed decay issues. Watch out for rainy periods during the 2019 harvest. If we end up in these wet patterns again in 2019, we could have a repeat of poor seed quality going into 2020. 

What does Phomopsis seed decay look like?

The fungus that causes Phomopsis seed decay (Fig. 4) can infect soybean plants early in the season and colonize pods and infect seeds near, or at maturity. Infected seed will often be shriveled or undersized and can have a white or chalky appearance. If pods are opened in the field a white cottony “mold” (different than that of white mold) can be observed. Infected seed can pass the Phomopsis seed decay fungus on in seedlings of the next soybean crop. Therefore, it is important to identify Phomopsis seed decay especially in soybean-seed fields.

What conditions are favorable for Phomopsis seed decay?

Warm and wet weather during pod fill and maturity favor the development of Phompsis seed decay. The conditions have been prevalent in areas of Wisconsin in 2019, especially where planting was delayed. Soybean varieties that mature early are also more prone to Phompsis seed decay. Other stresses such as nutrient deficiencies or virus infections can also increase the occurrence of Phompsis seed decay. Infested seed is a likely source of Phompsis seed decay, however, the fungus can survive on soybean debris and certain weeds like velvetleaf.

How should I handle soybeans with Phomopsis seed decay?

Scout fields before harvest to get an idea of how much Phomopsis seed decay you might have in a field. Scout multiple plants in at least 5 locations in a field, opening pods to determine if Phomopsis seed decay is present. In fields where Phomopsis seed decay is observed, harvest should be prioritized as soon as combines can enter the field. Seed infected with the Phomopsis seed decay fungus will continue to rot in the pod until they are harvested.

How should I manage Phomopsis seed decay in the 2020 soybean crop?

Soybean seed producers should try to clean seed to achieve less than 20% damaged seed in a seed lot. Multiple cleaning steps might be needed to achieve this level. While testing germination now is recommended, remember that testing germination again next spring and potentially just prior to delivery will also help you to understand the germination rate and determine if other management strategies need to be employed such as fungicidal seed treatments.

Seed treatments can help improve the germination rate of seed damaged by Diaporthe. However, you will need more than metalaxyl or mefonoxam active ingredients in your seed treatment. Metalaxyl and mefonoxam are good against Phytophthora and Pythium, but not effective against other organisms, like Diaporthe. Seed treatments with Phomopsis on the label have an additional fungicide (either a DMI or SDHI). Table 3-8 of the publication A3646 – Pest Management in Wisconsin Field Crops has a table of some of the seed treatments with Phomopsis on the label. Also available, as stated above, is the seed treatment efficacy table from the Crop Protection Network (CPN). You can download that publication by clicking here.

As farmers begin to look forward to the 2020 growing season we also recommend that you double check the percent germination on every seed lot prior to planting and adjust your seeding rates accordingly. Here are our recommendations for soybean seeding rate based on yield potential and white mold risk: The Soybean Seeding Rate Conundrum.

An Additional Phomopsis Seed Decay Resource

A fact sheet about Pod and Stem blight and Phomopsis seed decay has been developed by a consortium of soybean extension pathologists. You can download that fact sheet by clicking here.

Wisconsin Soybean White Mold Update – August 1, 2019

Damon Smith, Extension Field Crops Pathologist, Department of Plant Pathology, University of Wisconsin-Madison

Shawn Conley, Extension Soybean and Small Grains Agronomist, Department of Agronomy, University of Wisconsin-Madison

Roger Schmidt, Nutrient and Pest Management Program, University of Wisconsin-Madison

Figure 1. Sporecaster predictions for selected non-irrigated locations in Wisconsin for August 1, 2019.

Figure 1 illustrates the calculated risk of white mold for select Wisconsin locations for non-irrigated soybeans, as determined by Sporecaster for August 1, 2019. This means that if soybeans are flowering and the area between rows is filled in more than 50%, risk is mostly low for the presence of apothecia and subsequent white mold development at this point in the season. Figure 2 illustrates calculated risk for the same locations for irrigated soybeans planted to 30-in row spacing. As you can imagine, risk is even higher for irrigated soybeans planted to 15-in rows.

Mild and dry conditions recently have pushed the risk down dramatically in non-irrigated fields. The UW Field Crops Pathology Team continues to scout white mold locations for apothecia. We have only observed apothecia in irrigated fields in the Hancock area.

I’m Ready To Spray, What Should I use?

Figure 2. Sporecaster predictions for selected irrigated locations with soybeans planted to 30″ row-spacing in Wisconsin for August 1, 2019.

If the canopy has met threshold, soybeans are flowering, and your Sporecaster risk is high, then a fungicide might be warranted. If you have decided to spray soybeans for white mold, what are the best products to use? Over the last several years we have run numerous fungicide efficacy trials in Wisconsin and in conjunction with researchers in other states. Applications should be targeted during the R1-R3 growth stages in soybean. Research has shown that applications outside these growth stages, are often less effective. In Wisconsin, we have observed that Endura applied at 8 oz at the R1 growth stage performs well. We have also observed that the fungicide Aproach applied at 9 fl oz at R1 and again at R3 also performs comparably to the Endura treatment. Other fungicide options also include Omega and Proline. You can view results of past fungicide evaluations for Wisconsin by CLICKING HERE. If you would like to run tailored estimations of return on investment for various fungicide programs, you can use another smartphone application called Sporebuster.

Helpful Smartphone Application Links

Sporecaster

  1. Click here to download the Android version of Sporecaster. 
  2. Click here to download the iPhone version of Sporecaster.
  3. Here is a helpful video if you would like some tips on how to use Sporecaster. If you would like some advice on how to interpret the output, we have created an additional short video on this subject.

Sporebuster

  1. Click here to download the Android version of Sporebuster.
  2. Click here to download the iPhone version of Sporebuster.
  3. Here is a video on how to use Sporebuster and interpret the output.

Other White Mold Resources

  1. To watch an in-depth video on white mold management, CLICK HERE.
  2. To find more information and download a fact sheet on white mold from the Crop Protection Network, CLICK HERE.

Wisconsin Soybean White Mold Update – July 18, 2019

Damon Smith, Extension Field Crops Pathologist, Department of Plant Pathology, University of Wisconsin-Madison

Shawn Conley, Extension Soybean and Small Grains Agronomist, Department of Agronomy, University of Wisconsin-Madison

Roger Schmidt, Nutrient and Pest Management Program, University of Wisconsin-Madison

Figure 1. Sporecaster predictions for selected non-irrigated locations in Wisconsin for July 18, 2019.

Figure 1 illustrates the calculated risk of white mold for select Wisconsin locations for non-irrigated soybeans, as determined by Sporecaster for July 18, 2019. This means that if soybeans are flowering and the area between rows is filled in more than 50%, risk ranges from low to medium for the presence of apothecia and subsequent white mold development. Figure 2 illustrates calculated risk for the same locations for irrigated soybeans planted to 30-in row spacing. As you can imagine, risk is higher for irrigated soybeans planted to 15-in rows.

Extremely warm temperatures over the last week have pushed the risk down dramatically in non-irrigated fields. The UW Field Crops Pathology Team continues to scout white mold locations for apothecia. We have been unable to find apothecia at all locations we have visited over the last week.

I’m Ready To Spray, What Should I use?

Figure 2. Sporecaster predictions for selected irrigated locations with soybeans planted to 30″ row-spacing in Wisconsin for July 18, 2019.

If the canopy has met threshold, soybeans are flowering, and your Sporecaster risk is high, then a fungicide might be warranted. If you have decided to spray soybeans for white mold, what are the best products to use? Over the last several years we have run numerous fungicide efficacy trials in Wisconsin and in conjunction with researchers in other states. In Wisconsin, we have observed that Endura applied at 8 oz at the R1 growth stage performs well. We have also observed that the fungicide Aproach applied at 9 fl oz at R1 and again at R3 also performs comparably to the Endura treatment. Other fungicide options also include Omega and Proline. You can view results of past fungicide evaluations for Wisconsin by CLICKING HERE. If you would like to run tailored estimations of return on investment for various fungicide programs, you can use another smartphone application called Sporebuster.

Helpful Smartphone Application Links

Sporecaster

  1. Click here to download the Android version of Sporecaster. 
  2. Click here to download the iPhone version of Sporecaster.
  3. Here is a helpful video if you would like some tips on how to use Sporecaster. If you would like some advice on how to interpret the output, we have created an additional short video on this subject.

Sporebuster

  1. Click here to download the Android version of Sporebuster.
  2. Click here to download the iPhone version of Sporebuster.
  3. Here is a video on how to use Sporebuster and interpret the output.

Other White Mold Resources

  1. To watch an in-depth video on white mold management, CLICK HERE.
  2. To find more information and download a fact sheet on white mold from the Crop Protection Network, CLICK HERE.

Wisconsin Soybean White Mold Update – July 11, 2019

Figure 1. Sporecaster predictions for selected non-irrigated locations in Wisconsin for July 11, 2019.

Damon Smith, Extension Field Crops Pathologist, Department of Plant Pathology, University of Wisconsin-Madison

Shawn Conley, Extension Soybean and Small Grains Agronomist, Department of Agronomy, University of Wisconsin-Madison

Roger Schmidt, Nutrient and Pest Management Program, University of Wisconsin-Madison

Figure 1 illustrates the calculated risk of white mold for select Wisconsin locations for non-irrigated soybeans, as determined by Sporecaster for July 11, 2019. This means that if soybeans are flowering and the area between rows is filled in more than 50%, risk ranges from medium to high for the presence of apothecia and subsequent white mold development. Figure 2 illustrates calculated risk for the same locations for irrigated soybeans planted to 30-in row spacing. As you can imagine, risk is higher for irrigated soybeans planted to 15-in rows.

The UW Field Crops Pathology Team has started scouting white mold locations for apothecia. Overall, apothecia have not been observed at most locations, due to the fact that soybean canopies have not filled in to threshold. At only one location were we able to find apothecia and this location had met the canopy threshold. Remember, canopy closure is critical in calculating the probability of apothecial presence and subsequent white mold risk.

I’m Ready To Spray, What Should I use?

Figure 2. Sporecaster predictions for selected irrigated locations with soybeans planted to 30″ row-spacing in Wisconsin for July 11, 2019.

If the canopy has met threshold, soybeans are flowering, and your Sporecaster risk is high, then a fungicide might be warranted. If you have decided to spray soybeans for white mold, what are the best products to use? Over the last several years we have run numerous fungicide efficacy trials in Wisconsin and in conjunction with researchers in other states. In Wisconsin, we have observed that Endura applied at 8 oz at the R1 growth stage performs well. We have also observed that the fungicide Aproach applied at 9 fl oz at R1 and again at R3 also performs comparably to the Endura treatment. Other fungicide options also include Omega and Proline. You can view results of past fungicide evaluations for Wisconsin by CLICKING HERE. If you would like to run tailored estimations of return on investment for various fungicide programs, you can use another smartphone application called Sporebuster.

Helpful Smartphone Application Links

Sporecaster

  1. Click here to download the Android version of Sporecaster. 
  2. Click here to download the iPhone version of Sporecaster.
  3. Here is a helpful video if you would like some tips on how to use Sporecaster. If you would like some advice on how to interpret the output, we have created an additional short video on this subject.

Sporebuster

  1. Click here to download the Android version of Sporebuster.
  2. Click here to download the iPhone version of Sporebuster.
  3. Here is a video on how to use Sporebuster and interpret the output.

Other White Mold Resources

  1. To watch an in-depth video on white mold management, CLICK HERE.
  2. To find more information and download a fact sheet on white mold from the Crop Protection Network, CLICK HERE.

Wisconsin Late-Season Soybean Disease Update

Damon L. Smith, Extension Field Crops Pathologist, University of Wisconsin-Madison

The calls have been coming in this past week on a couple of soybean diseases. In the southern third of the state most of the calls have centered on sudden death syndrome or SDS. To the north, most questions pertain to Sclerotinia stem rot or white mold. I’ll discuss SDS in some detail, plus provide a detailed description of brown stem rot (BSR) which also typically shows up this time of year. Finally I’ll provide a brief update on the white mold situation.

Sudden death syndrome (SDS)

Symptoms of sudden death syndrome on soybeans

The first noticeable symptoms of SDS are chlorotic (i.e., yellow) blotches that form between the veins of soybean leaflets. These blotches expand into large, irregular, chlorotic patches (also between the veins), and this chlorotic tissue later dies and turns brown. Soon thereafter entire leaflets will die and shrivel. In severe cases, leaflets will drop off leaving the petioles attached. Taproots and below-ground portions of the stems of plants suffering from SDS, when split open, will exhibit a slightly tan to light brown discoloration of the vascular (i.e., water- conducting) tissue. The pith will remain white or cream-colored. In plants with advanced foliar symptoms of SDS, small, light blue patches will form on taproots and stems below the soil line. These patches are spore masses of the fungus that causes the disease.

Foliar symptoms of SDS can be confused with those of brown stem rot. However, in the case of brown stem rot (BSR), the pith of affected soybean plants will be brown. In addition, roots and lower stems of plants suffering from BSR will not have light blue spore masses.

Once symptoms of SDS are evident, yield losses are inevitable. Yield losses can range from slight to 100%, depending on the soybean variety being grown, the plant growth stage at the time of infection and whether or not SCN is present in a field. If SDS occurs after reproductive stages R5 or R6, impact on yield is usually less compared to the development of SDS at flowering that can lead to substantial yield losses. When SCN is present, the combined damage from both diseases can be substantially more than the sum of the damage expected from the individual diseases.

SDS is caused by the soilborne fungus, Fusarium virguliforme (synonym: F. solani f. sp. glycines). F. virguliforme can overwinter freely in the soil, in crop residue, and in the cysts of SCN. The fungus infects soybean roots (by some reports as early as one week after crop emergence), and is generally restricted to roots as well as stems near the soil line. F. virguliforme does not invade leaves, flowers, pods or seeds, but does produce toxins in the roots that move to the leaves, causing SDS’s characteristic foliar symptoms.

SDS cannot be controlled once plants have been infected. Foliar fungicides have NO effect on the disease.Recently a new seed treatment has been identified that has efficacy against SDS. The active ingredient fluopyram can be found in the seed treatment iLeVo and is rated “very good” in multi-state trials. Other methods of control include using SDS-resistant varieties whenever possible in fields with a history of the disease; however, keep in mind that SDS-resistant varieties with maturity groups suitable for Wisconsin and other northern regions (groups I and II) can be limited. If SDS and SCN are both problems in the same field, planting an SCN-resistant soybean variety may also be beneficial in managing SDS. Do not delay planting soybeans to avoid symptoms of SDS.  In Wisconsin, it has been demonstrated that the benefits to yield when planting early outweigh the benefits of reduced SDS symptoms if planting is delayed. Improve soil drainage by using tillage practices that reduce compaction problems. Rotation, while useful in managing other soybean diseases, does not appear to significantly reduce the severity of SDS. Even after several years of continuous production of corn, F. virguliforme populations typically are not reduced substantially. Research from Iowa State University has shown that corn (especially corn kernels) can harbor the SDS pathogen.

For more information CLICK HERE to download a full color fact sheet on SDS. A short video on SDS can also be viewed by CLICKING HERE.

Brown stem rot (BSR)

Symptoms of BSR in soybean stems compared with a healthy soybean stem in the center.

Symptoms of BSR are usually not evident until late in the growing season and may be confused with signs of crop maturity or the effect of dry soils. The most characteristic symptom of BSR is the brown discoloration of the pith especially at and between nodes near the soil line. This symptom is best scouted for at full pod stage. Foliar symptoms, although not always present, typically occur after air temperatures have been at to below normal during growth stages R3-R4, and often first appear at stage R5, peaking at stage R7. Foliar symptoms include interveinal chlorosis and necrosis (i.e., yellowing and browning of tissue between leaf veins), followed by leaf wilting and curling. Yield loss as a result of BSR is generally greatest when foliar symptoms develop. The severity of BSR symptoms increases when soil moisture is near field capacity (i.e., when conditions are optimal for crop development).

Foliar symptoms of BSR can be confused with those of sudden death syndrome (see description below). However, in the case of sudden death syndrome (SDS), the pith of affected soybean plants will remain white or cream-colored. In addition, roots and lower stems of plants suffering from SDS (but not those suffering from BSR) often have light blue patches indicative of spore masses of the fungus that causes SDS.

BSR is caused by the soilborne fungus Cadophora gregata. There are two distinct types (or genotypes) of the fungus, denoted Type A and Type B. Type A is the more aggressive strain and causes more internal damage and plant defoliation than Type B. P. gregata Type A also is associated with higher yield loss. P. gregata survives in soybean residue, with survival time directly related to the length of time that it takes for soybean residue to decay. Thus, P. gregata survives longer when soybean residue is left on the soil surface (e.g., in no till settings) where the rate of residue decay is slow. P. gregata infects soybean roots early in the growing season. It then moves up into the stems, invading the vascular system (i.e., the water-conducting tissue) and interfering with the movement of water and nutrients.

Several factors can influence BSR severity. Research from the University of Wisconsin has shown that the incidence and severity of BSR is greatest in soils with low levels of phosphorus and potassium, and a soil pH below 6.3. In addition, C. gregata and soybean cyst nematode (Heterodera glycines) frequently occur in fields together, and there is evidence that BSR is more severe in the presence of this nematode.

BSR cannot be controlled once plants have been infected. Foliar fungicides and fungicide seed treatments have NO effect on the disease. Use crop rotations of two to three years away from soybean with a non-host crop (e.g., small grains, corn, or vegetable crops), as well as tillage methods that incorporate plant residue into the soil. Both of these techniques will help reduce pathogen populations by promoting decomposition of soybean residue. Also, make sure that soil fertility and pH are optimized for soybean production to avoid overly low phosphorus and potassium levels, as well as overly low soil pH. Finally, grow soybean varieties with resistance to BSR. Complete resistance to BSR is not available in commercial varieties. However several sources of partial resistance that provide moderate to excellent BSR control are available. Also, some, but not all, varieties of soybean cyst nematode (SCN) resistant soybeans also are resistant to BSR. Most soybean varieties with SCN resistance derived from PI 88788 express resistance to BSR. However, the same is not true of varieties with SCN resistance derived from Peking. Therefore growers should consult seed company representatives about BSR resistance when selecting a variety with SCN resistance derived from this source. You can download a full color fact sheet on BSR by clicking here. You can also CLICK HERE to view a short video on BSR.

White Mold

White, fluffy growth of the white mold fungus on a soybean stem

Symptoms of white mold are becoming pretty apparent in Wisconsin. White fluffy growth (mycelium) is readily evident. Incidence in the northern half of the state is higher. We have visited fields as far north as Wausau and Pulaski, Wisconsin and have observed incidence ranging from 0% to 30% of plants infected. Reports from areas in the northwest indicate white mold present, but not as high of incidence levels. As we move to the southern portion of Wisconsin, white mold can be found, but at reasonably low levels. Most of the soybean crop is at the R5 growth stage, with some earlier maturing fields approaching R6. Questions have arisen about spraying fungicide now to reduce the damage caused by white mold and preserve yield. The short answer is NO. The reason is that the primary means of infection by the white mold fungus is through soybean flowers. These infections happened weeks ago. Therefore, the optimal time to spray would be when flowers were out. A low level of plant-to-plant transmission can occur late in the season in soybeans. However, this rate is low enough, that spraying to prevent it does not produce favorable results.

How much soybean yield might I lose from white mold?

Research has demonstrated that for every 10% increase in the number of plants that are infected with white mold at the R7 growth stage, you can expect between 2 to 5 bushels of yield loss. Thus, the fields I mentioned earlier will likely range from little detectable yield loss (3% incidence) to as high as 10 bushels lost (20% incidence).

What should I do if I see white mold in my soybean field now?

Get out and survey your fields for white mold. It is a good idea to determine how much white mold you have in your fields, so you can make some educated harvest decisions. One way to move white mold from one field to the next is via combines. You could clean your combine between each field, but this can be time consuming. So by determining which fields have no white mold and which fields have the most white mold, you can develop a logical harvest order by beginning your harvest on fields with no white mold and working your way to the heavily infested fields. This will help reduce spread of the white mold fungus to fields that aren’t infested. You can also make some decisions on your rotation plan and future soybean variety choices based on these late season observations.

If you would like to learn more about white mold and management of this disease, CLICK HERE to download a fact sheet from the crop protection network. You can also watch a short video about white mold by CLICKING HERE.

Wisconsin White Mold Risk Maps – July 29, 2018

Damon L. Smith, Extension Field Crops Pathologist, University of Wisconsin-Madison

**These maps are for guidance only and should be used with other sources of information and professional advice when determining risk of white mold development. For field-specific predictions, we encourage you to use the Sporecaster smartphone application. These predictions will be most accurate for your specific location. Information about Sporecaster and how to download can be found by clicking here. Sporecaster takes into account crop phenology, in addition to weather parameters, to make field-specific recommendations. The maps below are based on weather only and you must determine if your crop is currently phenologically at risk for infection. For more information on white mold and how to manage it, see my previous post.**


Map Legends: No color = model is inactive and risk of apothecia in the field is not likely; Gray = apothecia might be present, but likelihood of apothecial presence is extremely low; Blue = low risk of apothecia; Yellow = medium risk of apothecia in the field; Red = high risk of apothecia in the field. Model predictions must be combined with soybean growth stage and canopy characteristics to aid in timing of fungicide sprays.


Figure 1. White Mold Risk Map for Non-irrigated Fields – July 29, 2018

Cooler, dry weather has changed the white mold risk map over the last several weeks for non-irrigated (dryland or rain-fed) soybean fields (Figure 1). Cool weather has generated some areas of high risk in the southwest, western, and north-central regions of the state. However, the dry conditions have dissipated much of the moderate and low risk areas that showed several weeks ago. Risk in general is much more spotty than it has been. The soybean crop is also moving through growth stages much more rapidly than in 2017. Thus, the risk window for infection by the white mold fungus will end soon. Remember that once the crop has finished flowering risk of new infections is low to non-existent. In addition, late applications (R4 and later growth stages) of fungicide will not be needed for white mold control.


Figure 2. White Mold Risk Map for irrigated fields planted on 15″ row-spacing – July 29, 2018

Risk remains high across much of the state for irrigated soybeans planted to 15″ rows (Figure 2). Risk is starting to dissipate in areas in the east-central region, due to dryer conditions. However, a fungicide application should be considered if irrigating and soybeans are flowering and planted to a 15″ row-spacing. Note that if you have irrigation in your field but are not actually irrigating, you should be using the non-irrigated model above to make an accurate prediction of white mold risk.


Figure 3. White Mold Risk Map for irrigated fields planted on 30″ row-spacing – July 29, 2018

Risk of white mold in irrigated fields planted to 30″ row-spacing has decreased a bit in some areas, since the last post (Figure 3). However, Much of the state is at risk if irrigating on 30″ spaced soybeans. In these areas, a fungicide application should be considered if soybeans are being irrigated, canopy is nearly closed, and flowers are present. Note that if you have irrigation in your field but are not actually irrigating, you should be using the non-irrigated model above to make an accurate prediction of white mold risk.


These models were developed at the University of Wisconsin-Madison in conjunction with Michigan State University and Iowa State University to identify at-risk regions which have been experiencing weather favorable for the development of white mold fungus apothecia. Weather information and maps are provided by the Soybean Integrated Pest Information Platform for Extension and Education (iPIPE), which is managed by ZedX, Inc. These models predict when apothecia will be present in the field using combinations of 30-day averages of maximum temperature, relative humidity, and maximum wind speed. Using virtually available weather data, predictions can be made in most soybean growing regions. Based on these predictions, a map is generated under three scenarios (non-irrigated soybeans, soybeans planted on 15″ row-spacing and irrigated, or soybeans planted on 30″ row-spacing and irrigated). The maps are colored to show the likelihood of apothecial presence within a region.  If the model is predicting high risk (red) in your area for your planting scenario, the soybeans are flowering, and the canopy is somewhat closed, then the white mold risk is high. If your fields are at-risk, we recommend to consult your local extension personnel or other research-based resources for the best in-season management options for your area.

Wisconsin White Mold Risk Maps – July 15, 2018

Damon L. Smith, Extension Field Crops Pathologist, University of Wisconsin-Madison

**These maps are for guidance only and should be used with other sources of information and professional advice when determining risk of white mold development. For field-specific predictions, we encourage you to use the Sporecaster smartphone application. These predictions will be most accurate for your specific location. Information about Sporecaster and how to download can be found by clicking here. Sporecaster takes into account crop phenology, in addition to weather parameters, to make field-specific recommendations. The maps below are based on weather only and you must determine if your crop is currently phenologically at risk for infection. For more information on white mold and how to manage it, see my previous post.**


Map Legends: No color = model is inactive and risk of apothecia in the field is not likely; Gray = apothecia might be present, but likelihood of apothecial presence is extremely low; Blue = low risk of apothecia; Yellow = medium risk of apothecia in the field; Red = high risk of apothecia in the field. Model predictions must be combined with soybean growth stage and canopy characteristics to aid in timing of fungicide sprays.


Figure 1. White Mold Risk Map for Non-irrigated Fields – July 15, 2018

Hot, dry weather continues to push risk for white mold down in non-irrigated (dryland or rain-fed) soybean fields (Figure 1). While risk is high in some locations of the state, there is much more yellow on the map compared to last week, indicating medium risk. Continued areas of high risk are present along Lake Michigan and in the central and southwest portions of Wisconsin. In these areas, a fungicide application should be considered if the soybean canopy is nearly closed and flowers are present.

Figure 2. White Mold Risk Map for irrigated fields planted on 15″ row-spacing – July 15, 2018

Risk remains high across the state for irrigated soybeans planted to 15″ rows (Figure 2). A fungicide application should be considered if irrigating and soybeans are flowering and planted to a 15″ row-spacing. Note that if you have irrigation in your field but are not actually irrigating, you should be using the non-irrigated model above to make an accurate prediction of white mold risk.

Figure 3. White Mold Risk Map for irrigated fields planted on 30″ row-spacing – July 15, 2018

Risk of white mold in irrigated fields planted to 30″ row-spacing has increased significantly since last week (Figure 3). Much of the state is at risk if irrigating on 30″ spaced soybeans. In these areas, a fungicide application should be considered if soybeans are being irrigated, canopy is nearly closed, and flowers are present.


These models were developed at the University of Wisconsin-Madison in conjunction with Michigan State University and Iowa State University to identify at-risk regions which have been experiencing weather favorable for the development of white mold fungus apothecia. Weather information and maps are provided by the Soybean Integrated Pest Information Platform for Extension and Education (iPIPE), which is managed by ZedX, Inc. This model predicts when apothecia will be present in the field using combinations of 30-day averages of maximum temperature, relative humidity, and maximum wind speed. Using virtually available weather data, predictions can be made in most soybean growing regions. Based on these predictions, a map is generated under three scenarios (non-irrigated soybeans, soybeans planted on 15″ row-spacing and irrigated, or soybeans planted on 30″ row-spacing and irrigated). The maps are colored to show the likelihood of apothecial presence within a region.  If the model is predicting high risk (red) in your area for your planting scenario, the soybeans are flowering, and the canopy is somewhat closed, then the white mold risk is high. If your fields are at-risk, we recommend to consult your local extension personnel or other research-based resources for the best in-season management options for your area

Wisconsin White Mold Risk Maps – July 8, 2018

Damon L. Smith, Extension Field Crops Pathologist, University of Wisconsin-Madison

**These maps are for guidance only and should be used with other sources of information and professional advice when determining risk of white mold development. For field-specific predictions, we encourage you to use the Sporecaster smartphone application. These predictions will be most accurate for your specific location. Information about Sporecaster and how to download can be found by clicking here. Sporecaster takes into account crop phenology, in addition to weather parameters, to make field-specific recommendations. The maps below are based on weather only and you must determine if your crop is currently phenologically at risk for infection. For more information on white mold and how to manage it, see my previous post.**


Map Legends: No color = model is inactive and risk of apothecia in the field is not likely; Gray = apothecia might be present, but likelihood of apothecial presence is extremely low; Blue = low risk of apothecia; Yellow = medium risk of apothecia in the field; Red = high risk of apothecia in the field. Model predictions must be combined with soybean growth stage and canopy characteristics to aid in timing of fungicide sprays.


Figure 1. White Mold Risk Map for Non-irrigated Fields – July 8, 2018

Continued dry and windy weather is beginning to reduce the predicted risk of white mold across Wisconsin in non-irrigated (dryland or rain-fed) soybean fields (Figure 1). While risk is high in some locations of the state, there is much more yellow and blue on the map compared to last week, indicating medium to low risk. Over the next week, I expect risk to continue to dissipate as weather is predicted to remain warm and dry. Areas of high risk are present along Lake Michigan and in the central and southwest portions of Wisconsin. In these areas, a fungicide application should be considered if the soybean canopy is nearly closed and flowers are present.

Figure 2. White Mold Risk Map for irrigated fields planted on 15″ row-spacing – July 8, 2018

As you might expect, risk is much higher across the state for irrigated soybeans planted to 15″ rows (Figure 2). Remember that there are different models for irrigated and non-irrigated soybeans. Thus predictions can vary across the state in these environments. A fungicide application should be considered if irrigating and soybeans are flowering and planted to a 15″ row-spacing. Note that if you have irrigation in your field but are not actually irrigating, you should be using the non-irrigated model above to make an accurate prediction of white mold risk.

Figure 3. White Mold Risk Map for irrigated fields planted on 30″ row-spacing – July 8, 2018

Risk of white mold in irrigated fields planted to 30″ row-spacing is much a bit less than in 15″ spacing (Figure 3). However, areas of high risk are present in the southwest and far northern areas of soybean production. In these areas, a fungicide application should be considered if soybeans are being irrigated, canopy is nearly closed, and flowers are present.


These models were developed at the University of Wisconsin-Madison in conjunction with Michigan State University and Iowa State University to identify at-risk regions which have been experiencing weather favorable for the development of white mold fungus apothecia. Weather information and maps are provided by the Soybean Integrated Pest Information Platform for Extension and Education (iPIPE), which is managed by ZedX, Inc. This model predicts when apothecia will be present in the field using combinations of 30-day averages of maximum temperature, relative humidity, and maximum wind speed. Using virtually available weather data, predictions can be made in most soybean growing regions. Based on these predictions, a map is generated under three scenarios (non-irrigated soybeans, soybeans planted on 15″ row-spacing and irrigated, or soybeans planted on 30″ row-spacing and irrigated). The maps are colored to show the likelihood of apothecial presence within a region.  If the model is predicting high risk (red) in your area for your planting scenario, the soybeans are flowering, and the canopy is somewhat closed, then the white mold risk is high. If your fields are at-risk, we recommend to consult your local extension personnel or other research-based resources for the best in-season management options for your area