It’s Time for Fireworks and Spores To Fly: Independence Week in Wisconsin Brings White Mold Management Decisions

Damon Smith, Extension Field Crops Pathologist, Department of Plant Pathology, University of Wisconsin-Madison

Shawn Conley, Extension Soybean and Small Grains Agronomist, Department of Agronomy, University of Wisconsin-Madison

Roger Schmidt, Nutrient and Pest Management Program, University of Wisconsin-Madison

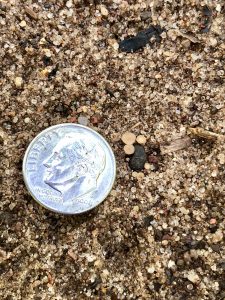
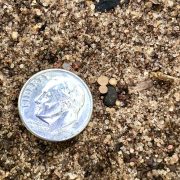
Figure 1. Apothecia, small mushroom-like structures of the white mold fungus that give rise to spores, which infect soybean flowers. Note the small pale orange structures to the right of the dime.

The week of Independence day is here and we are all looking forward to fireworks, festivities, and time with friends and family. This first week of July also brings us a heightened awareness of white mold in soybeans and its management. In 2017 we had one of the most epic white mold epidemics on record. Many high-yielding soybean fields in the state were slammed with white mold, resulting in some serious yield losses in many fields around Wisconsin. I have been asked many times this season, “Are we in for white mold as bad as 2017?” The short answer is no, I don’t think so.

Weather in 2017 was incredibly cool for the majority of the time. This had two effects which were responsible for the extreme white mold epidemic in 2017. First, soybeans moved extremely slow through each growth stage. This meant that the flowering window went on for about twice as long as normal for many of the varieties of soybeans we grow here in Wisconsin. This extended flowering period resulted in an extended period of time that soybeans were susceptible to infection. Remember that the white mold fungus infects soybeans through open and senescing flower, by spores that are born from small mushroom-like structures called apothecia (Fig. 1). This extended bloom period meant that the window of opportunity for the fungus was also extended. Couple this with the fact that those same cool conditions were also optimal for the fungus to infect and grow. It was a double whammy in 2017.

In 2018, the season has already seen several instances of 2 or 3 day durations of high temperatures of 90F or above. This has done a couple of things. It has pushed the soybean crop very quickly this year. I estimate that the crop is about 2 weeks ahead of last season, in the southern and south-central region of Wisconsin. With continued stretches of warm weather in the forecast, I expect flowering duration to be closer to ‘normal’, or at least shorter than last season. This means the crop won’t be subjected to such a long period of susceptibility, compared to 2017. Furthermore, these stretches of high temperatures of 90F or above should make conditions somewhat less conducive for the fungus. With that said, we need to pay attention to weather as we have had plenty of rain and humidity, which can be favorable for white mold. So will we have white mold in Wisconsin in 2018? Yes. Will it be has significant as 2017, I hope not.

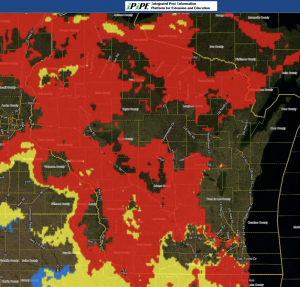
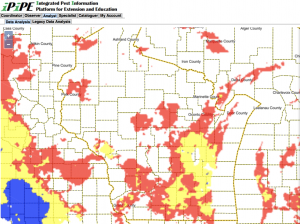
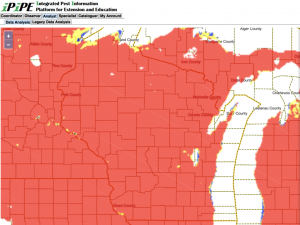
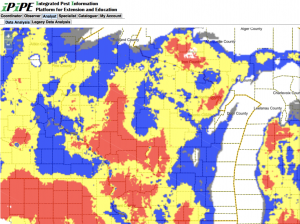
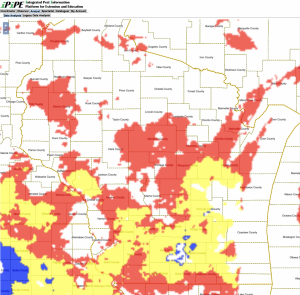
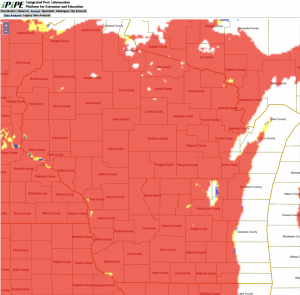
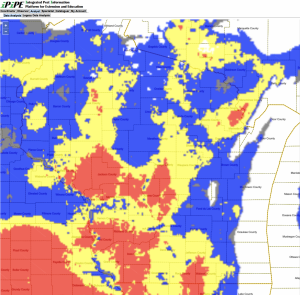
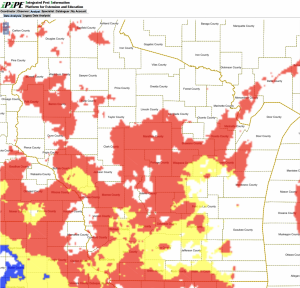
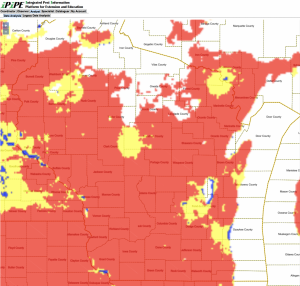
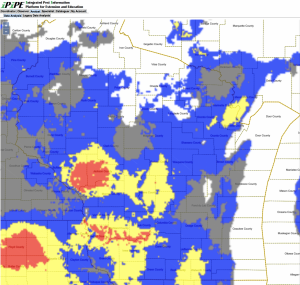
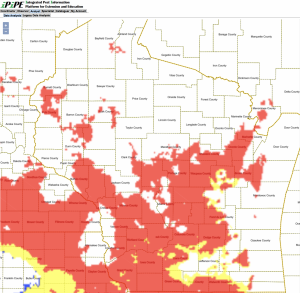
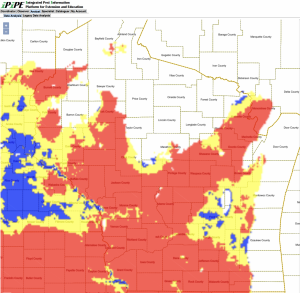
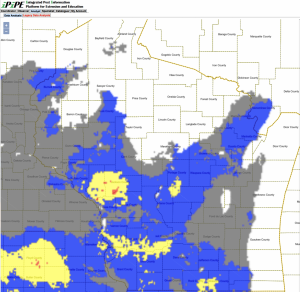
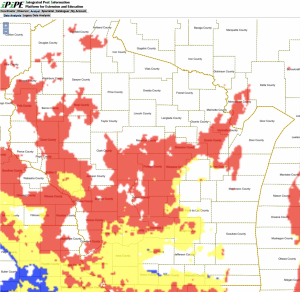
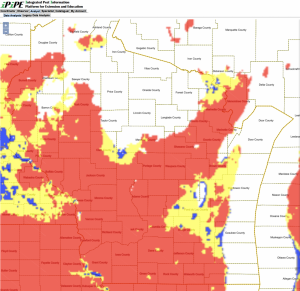
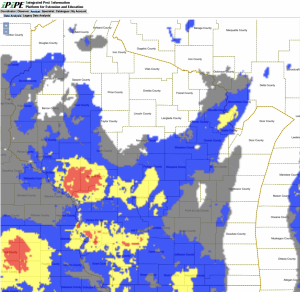
Figure 2. White mold predictions for rain-fed (non-irrigated) fields for June 30, 2018. Blue indicates low risk, yellow medium risk, and red indicates high risk of infection for flowering soybeans.

Predicting White Mold

The flowering growth stages are a critical time to manage white mold in-season. You can view a fact sheet and video on the subject. As you probably know, timing in-season fungicide sprays at the correct time during the soybean bloom period can be extremely difficult. To help solve this decision-making issue, models were developed at the University of Wisconsin-Madison in conjunction with Michigan State University and Iowa State University to identify at-risk regions which have been experiencing weather favorable for the development of white mold apothecia. These models predict when apothecia will be present in the field using combinations of 30-day averages of maximum temperature, relative humidity, and wind speed. Using virtually available weather data, predictions can be made in most soybean growing regions. In past years we have overlaid model outputs onto maps to achieve a landscape view of the current risk. An example of a current map for this season is in figure 2. You can see we have some areas of favorable weather for white mold risk. However, more precise predictions would help determine the site-specific risk. To facilitate more precise predictions, we have launched the Sporecaster smartphone application for Android and iPhone for the 2018 season.

The purpose of the app is to assist farmers in making early season management decisions for white mold in soybean. The best time to spray fungicides for white mold is during flowering (R1 and R3 growth stages) when apothecia are present on the soil surface.

Sporecaster uses university research to turn a few simple taps on a smartphone screen into an instant forecast of the risk of apothecia being present in a soybean field, which helps growers predict the best timing for white mold treatment during the flowering period.

University research has indicated that the appearance of apothecia can be predicted using weather data and a threshold of percent soybean canopy row closure in a field. Based on these predictions and crop phenology, site-specific risk values are generated for three scenarios (non-irrigated soybeans, soybeans planted on 15″ row-spacing and irrigated, or soybeans planted on 30″ row-spacing and irrigated). Though not specifically tested we would expect row-spacings of 22 inches or less to have a similar probability response to fungicide as the 15 inch row-spacing.

The Sclerotinia apothecial models that underlie the Sporecaster prediction tool have undergone significant validation in both small test plots and in commercial production fields. In 2017, efficacy trials were conducted at agricultural research stations in Iowa, Michigan, and Wisconsin to identify fungicide application programs and thresholds for model implementation. Additionally, apothecial scouting and disease monitoring were conducted in a total of 60 commercial farmer fields in Michigan, Nebraska, and Wisconsin between 2016 and 2017 to evaluate model accuracy across the growing region. Across all irrigated and non-irrigated locations predictions during the soybean flowering period (R1 to early R4 growth stages) were found to explain end-of-season disease observations with an accuracy of 81.8% using the established probability thresholds now programmed in the app.

Click here to download the Android version of Sporecaster. 

Click here to download the iPhone version of Sporecaster.

Here is a helpful video if you would like some tips on how to use Sporecaster. If you would like some advice on how to interpret the output, we have created an additional short video on this subject.

What to Spray for White Mold?

If you have decided to spray soybeans for white mold, what are the best products to use? Over the last several years we have run numerous fungicide efficacy trials in Wisconsin and in conjunction with researchers in other states. In Wisconsin, we have observed that Endura applied at 8 oz at the R1 growth stage performs well. We have also observed that the fungicide Aproach applied at 9 fl oz at R1 and again at R3 also performs comparably to the Endura treatment. Other fungicide options also include Omega and Proline. You can view results of past fungicide evaluations by CLICKING HERE.

Some Other Resources

  1. For some other ideas on how to manage white mold you can visit this recent article.
  2. To find out how Xtend varieties respond against white mold, CLICK HERE.
  3. To watch an in-depth video on white mold management, CLICK HERE.

References

  1. Willbur, J.F., Fall, M.L., Blackwell, T., Bloomingdale, C.A., Byrne, A.M., Chapman, S.A., Holtz, D., Isard, S.A., Magarey, R.D., McCaghey, M., Mueller, B.D., Russo, J.M., Schlegel, J., Young, M., Chilvers, M.I., Mueller, D.S., and Smith, D.L.2018. Weather-based models for assessing the risk of Sclerotinia sclerotiorum apothecial presence in soybean (Glycine max) fields. Plant Disease.DOI:10.1094/PDIS-04-17-0504-RE
  2. Willbur, J.F.,Fall, M.L., Byrne, A.M., Chapman, S.A., McCaghey, M.M., Mueller, B.D., Schmidt, R., Chilvers, M.I., Mueller, D.S., Kabbage, M., Giesler, L.J., Conley, S.P., and Smith, D.L. 2018. Validating Sclerotinia sclerotiorumapothecial models to predict Sclerotinia stem rot in soybean (Glycine max) fields. Plant Disease. https://doi.org/10.1094/PDIS-02-18-0245-RE.
  3. Fall, M., Willbur, J., Smith, D.L., Byrne, A., and Chilvers, M. 2018. Spatiotemporal distribution pattern of Sclerotinia sclerotiorum apothecia is modulated by canopy closure and soil temperature in an irrigated soybean field. Phytopathology. https://doi.org/10.1094/PDIS-11-17-1821-RE.


New Video: Early Season Management Options for White Mold in Soybean

Damon Smith, Extension Field Crops Pathologist, Department of Plant Pathology, University of Wisconsin-Madison

In this video I visit a soybean field to talk about white mold, row spacing, planting population and the new Sporecaster white mold management smartphone app. in an effort to develop an integrated management strategy for white mold control.

A Look Into Soybean Checkoff Funded Collaborative International Research and Outreach

Damon Smith, Extension Field Crops Pathologist, Department of Plant Pathology, University of Wisconsin-Madison

Many public universities collaborate on international research and outreach efforts, but you may not understand the impact that this work can have even for farmers in the Midwest. We have assembled three new videos in a series, in an effort to demonstrate our impact in conducting collaborative research and outreach work. This work is ongoing and is being conducted in Chile and here in the Midwest. The focus is to produce soybean germplasm that is highly resistant to white mold, a major disease in the upper Midwest. This research is funded by the Wisconsin Soybean Marketing Board and the North Central Soybean Research Program. Travel support for graduate student, Megan McCaghey, was all made possible by the Walter R. Stevenson Fund for Graduate Student Travel. This collaborative effort includes researchers here at the University of Wisconsin-Madison and Researchers at Iowa State University, including Dr. Daren Mueller. We would like to thank Brandon Kleinke, Iowa State University, for his work in shooting video footage and assembling this video series. To watch the videos, click here.

New smartphone app: Sporecaster, The Soybean White Mold Forecaster

Damon Smith, Field Crops Extension Pathologist, University of Wisconsin-Madison

Roger Schmidt, Nutrient and Pest Management Program, University of Wisconsin-Madison

Shawn Conley, Soybean Extension Agronomist, University of Wisconsin-Madison

Sporecaster: A New Soybean White Mold Prediction App for your Smartphone

Sporecaster is a new smartphone application designed to help farmers predict the need for a fungicide application to control white mold in soybean. The app, which is free to use, was developed with support from the Wisconsin Soybean Association and Wisconsin Soybean Marketing Board. It was programmed by personnel in the UW-Madison Nutrient and Pest Management Program.

Sporecaster uses university research to turn a few simple taps on a smartphone screen into an instant forecast of the risk of apothecia being present in a soybean field, which helps growers predict the best timing for white mold treatment during the flowering period.

To learn more about the app, how to download and how to use it, click here.

New Video: Integrated Approaches to White Mold Management

Damon L. Smith, Extension Field Crops Pathologist, University of Wisconsin-Madison

Have you been struggling with white mold in soybeans over the last couple of field seasons? Do you want to know more about possible approaches to managing white mold in soybean? You might find this new video helpful in your operation. Dr. Damon Smith, UW Field Crops Pathologist, discusses recent data on research of soybean white mold in the North Central U.S. He also provides management recommendations that farmers and practitioners should consider to manage this persistent disease of soybean. For more information on managing white mold you can consult the UW Field Crops Pathology webpage by CLICKING HERE and scrolling down to the white mold section or visit the Crop Protection Network webpage on white mold.

Wisconsin White Mold Risk Maps – August 5, 2017

Jaime Willbur, Graduate Research Assistant, University of Wisconsin-Madison

Sclero-cast: A Soybean White Mold Prediction Model

**This tool is for guidance only and should be used with other sources of information and professional advice when determining risk of white mold development. We encourage you to read the model how-to guide which can be downloaded by clicking here**

Continued dry conditions over the past couple of weeks have helped to continue to decrease white mold risk in non-irrigated fields (Fig. 1). Some areas of high risk still exist in the southern and eastern portions of the state. However, many fields we have visited are moving to R3 and R4 growth stages. Thus, they are getting outside of the extremely critical period for infection by the white mold fungus. Some reports of symptoms of white mold are beginning to come in. I suspect we will begin to see more symptoms of disease over the next couple of weeks and will begin to get an understanding of how severe the epidemic will be this year.

Risk remains high for any soybeans planted to 15-inch rows AND irrigated (Fig. 2). This planting and management scenario is highly conducive for white mold development. We continue to find apothecia under irrigation and in 15-inch row-spacing. I would expect to see significantly higher levels of white mold in irrigated soybeans planted to 15-inch rows. Risk of white mold remained steady for soybeans planted to 30-inch rows and irrigated (Fig. 3). Risk remains high in the southwestern and western portions of Wisconsin for soybeans planted to 30-inch rows and irrigated (Fig. 3).

Forecasts indicate cool temperatures with chances of precipitation for the next week. I would expect white mold risk to hold steady. Continue to growth-stage soybeans and note that map predictions should be considered for making white mold management decisions if soybeans are flowering AND soybean canopies are nearly closed. We have visited fields all over the state and find soybeans well into the reproductive growth stages. We are quickly getting outside the window of opportunity to treat for white mold. Any remaining white mold management decisions should be made very soon. For more information on white mold and white mold management, see this previous post.

Figure 1. Apothecial Risk for non-irrigated soybean fields (August 5, 2017)

Figure 2. Apothecial Risk for soybeans planted to 15″ rows, under irrigation (August 5, 2017)

Figure 3. Apothecial Risk for soybeans planted to 30″ rows, under irrigation (August 5, 2017)

Map Legend: White = model is inactive and risk of apothecia in the field is likely low; Gray = apothecia might be present, but likelihood of apothecial presence is less than 5%; Blue = low risk of apothecia in the field (5 to <15% chance); Yellow = moderate risk of apothecia in the field (15 to <30% chance); Red = high risk of apothecia in the field (30% or higher chance). Model predictions must be combined with soybean growth stage and canopy characteristics to aid in timing of fungicide sprays.


These models were developed at the University of Wisconsin-Madison in conjunction with Michigan State University and Iowa State University to identify at-risk regions which have been experiencing weather favorable for the development of white mold fungus apothecia. Weather information and maps are provided by the Soybean Integrated Pest Information Platform for Extension and Education (iPIPE), which is managed by ZedX, Inc. This model predicts when apothecia will be present in the field using combinations of 30-day averages of maximum temperature, relative humidity, and maximum wind speed. Using virtually available weather data, predictions can be made in most soybean growing regions. Based on these predictions, a map is generated under three scenarios (non-irrigated soybeans, soybeans planted on 15″ row-spacing and irrigated, or soybeans planted on 30″ row-spacing and irrigated). The maps are colored to show the likelihood of apothecial presence within a region.  If the model is predicting high risk (red) in your area for your planting scenario, the soybeans are flowering, and the canopy is somewhat closed, then the white mold risk is elevated. If your fields are at-risk, we recommend to consult your local extension personnel or resources for the best in-season management options for your area For further information on how to use and interpret these risk maps, CLICK HERE to download a how-to guide.

Wisconsin White Mold Risk Maps – July 27, 2017

Jaime Willbur, Graduate Research Assistant, University of Wisconsin-Madison

Sclero-cast: A Soybean White Mold Prediction Model

**This tool is for guidance only and should be used with other sources of information and professional advice when determining risk of white mold development. We encourage you to read the model how-to guide which can be downloaded by clicking here**

Mostly dry conditions over the past week helped to decrease white mold risk in non-irrigated fields in many locations in the southern and south-central portion of the state (Fig. 1). However, risk remains high in the central area of the state and in portions of the far southern tier of counties.

Risk has increased substantially across the entire state for any soybeans planted to 15-inch rows AND irrigated (Fig. 2). This planting and management scenario is highly conducive for white mold development. We are finding increased numbers of apothecia under irrigation and in 15-inch row-spacing. Risk of white mold also increased slightly in the southwestern and western portions of Wisconsin for soybeans planted to 30-inch rows and irrigated (Fig. 3).

Forecasts indicate seasonable temperatures with little precipitation for the next week. This will give many of us a chance to dry out a bit from above-normal rainfall in July. I expect white mold risk to hold steady or decrease a bit given the forecasts. Continue to growth-stage soybeans and note that map predictions should be considered for making white mold management decisions if soybeans are flowering AND soybean canopies are nearly closed.  For more information on white mold and white mold management, see this previous post.

Figure 1. Apothecial Risk for non-irrigated soybean fields (July 27, 2017)

Figure 2. Apothecial Risk for soybeans planted to 15″ rows, under irrigation (July 27, 2017)

Figure 3. Apothecial Risk for soybeans planted to 30″ rows, under irrigation (July 27, 2017)

Map Legend: White = model is inactive and risk of apothecia in the field is likely low; Gray = apothecia might be present, but likelihood of apothecial presence is less than 5%; Blue = low risk of apothecia in the field (5 to <15% chance); Yellow = moderate risk of apothecia in the field (15 to <30% chance); Red = high risk of apothecia in the field (30% or higher chance). Model predictions must be combined with soybean growth stage and canopy characteristics to aid in timing of fungicide sprays.


These models were developed at the University of Wisconsin-Madison in conjunction with Michigan State University and Iowa State University to identify at-risk regions which have been experiencing weather favorable for the development of white mold fungus apothecia. Weather information and maps are provided by the Soybean Integrated Pest Information Platform for Extension and Education (iPIPE), which is managed by ZedX, Inc. This model predicts when apothecia will be present in the field using combinations of 30-day averages of maximum temperature, relative humidity, and maximum wind speed. Using virtually available weather data, predictions can be made in most soybean growing regions. Based on these predictions, a map is generated under three scenarios (non-irrigated soybeans, soybeans planted on 15″ row-spacing and irrigated, or soybeans planted on 30″ row-spacing and irrigated). The maps are colored to show the likelihood of apothecial presence within a region.  If the model is predicting high risk (red) in your area for your planting scenario, the soybeans are flowering, and the canopy is somewhat closed, then the white mold risk is elevated. If your fields are at-risk, we recommend to consult your local extension personnel or resources for the best in-season management options for your area For further information on how to use and interpret these risk maps, CLICK HERE to download a how-to guide.

Wisconsin White Mold Risk Maps – July 21, 2017

Damon L. Smith, Extension Field Crops Pathologist, University of Wisconsin-Madison

Jaime Willbur, Graduate Research Assistant, University of Wisconsin-Madison

Sclero-cast: A Soybean White Mold Prediction Model

**This tool is for guidance only and should be used with other sources of information and professional advice when determining risk of white mold development. We encourage you to read the model how-to guide which can be downloaded by clicking here**

Higher average temperatures this week helped to decrease white mold risk in non-irrigated fields in some locations in the southern and south-central portion of the state (Fig. 1). However, risk remains high in the central area of the state and in portions of the western region.

Areas of high risk have increased in irrigated soybeans planted to 15-inch rows (Fig. 2). Soybeans planted to 15-inch rows and irrigated are under high risk for white mold development in much of the state of Wisconsin. This is consistent with our field observations. Our crew has mostly found apothecia (the small, cup-shaped mushroom) in fields that are irrigated and planted to the 15″ row-spacing. Risk of white mold increased slightly in several pockets along the Wisconsin River Valley and in Jackson and Trempealeau Counties for soybeans planted to 30-inch rows and irrigated (Fig. 3).

Forecasts indicate cooler weather next week. This may increase risk further in some areas, depending on where dew and rain events occur. Continue to growth-stage soybeans and note that map predictions should be considered for making white mold management decisions if soybeans are flowering AND soybean canopies are nearly closed.  For more information on white mold and white mold management, see this previous post.

Figure 1. Apothecial Risk for non-irrigated soybean fields (July 21, 2017)

Figure 2. Apothecial Risk for soybeans planted to 15″ rows, under irrigation (July 21, 2017)

Figure 3. Apothecial Risk for soybeans planted to 30″ rows, under irrigation (July 21, 2017)

Map Legend: White = model is inactive and risk of apothecia in the field is likely low; Gray = apothecia might be present, but likelihood of apothecial presence is less than 5%; Blue = low risk of apothecia in the field (5 to <15% chance); Yellow = moderate risk of apothecia in the field (15 to <30% chance); Red = high risk of apothecia in the field (30% or higher chance). Model predictions must be combined with soybean growth stage and canopy characteristics to aid in timing of fungicide sprays.


These models were developed at the University of Wisconsin-Madison in conjunction with Michigan State University and Iowa State University to identify at-risk regions which have been experiencing weather favorable for the development of white mold fungus apothecia. Weather information and maps are provided by the Soybean Integrated Pest Information Platform for Extension and Education (iPIPE), which is managed by ZedX, Inc. This model predicts when apothecia will be present in the field using combinations of 30-day averages of maximum temperature, relative humidity, and maximum wind speed. Using virtually available weather data, predictions can be made in most soybean growing regions. Based on these predictions, a map is generated under three scenarios (non-irrigated soybeans, soybeans planted on 15″ row-spacing and irrigated, or soybeans planted on 30″ row-spacing and irrigated). The maps are colored to show the likelihood of apothecial presence within a region.  If the model is predicting high risk (red) in your area for your planting scenario, the soybeans are flowering, and the canopy is somewhat closed, then the white mold risk is elevated. If your fields are at-risk, we recommend to consult your local extension personnel or resources for the best in-season management options for your area For further information on how to use and interpret these risk maps, CLICK HERE to download a how-to guide.

Wisconsin White Mold Risk Maps – July 17, 2017

Damon L. Smith, Extension Field Crops Pathologist, University of Wisconsin-Madison

Jaime Willbur, Graduate Research Assistant, University of Wisconsin-Madison

Sclero-cast: A Soybean White Mold Prediction Model

**This tool is for guidance only and should be used with other sources of information and professional advice when determining risk of white mold development. We encourage you to read the model how-to guide which can be downloaded by clicking here**

Risk of apothecial presence and subsequent white mold development has increased over the past week in non-irrigated fields (Fig. 1). Cool temperatures and high moisture have increased risk to high levels especially along the southern tier of counties, and into Dodge and Fond du Lac counties. Risk remains high in west-central to northwest portions of Wisconsin and in a band stretching from south-central Wisconsin to northeast Wisconsin.

Areas of high risk have remained steady in irrigated soybeans planted to 15-inch rows (Fig. 2) and 30-inch rows (Fig. 3). Soybeans planted to 15-inch rows and irrigated are under high risk for white mold development in the southern region west-central region and in a band stretching from central to northeast Wisconsin. Risk in irrigated soybeans planted to 30-inch row spacing remains low to moderate.

The Field Crops Pathology crew has also started scouting commercial fields, and research plots, for apothecia. Consistent with the models, we have found apothecia under irrigation on the central sands. We did not find apothecia in dryland environments in the southern tier of the state, where there was low-to-moderate risk expected.

I expect risk to continue to remain steady over the next week, as heat will be accompanied by frequent rain events. Continue to growth-stage soybeans and note that map predictions should be considered for making white mold management decisions if soybeans are flowering AND soybean canopies are nearly closed.  For more information on white mold and white mold management, see this previous post.

Figure 1. Apothecial Risk for non-irrigated soybean fields (July 17, 2017)

Figure 2. Apothecial Risk for soybeans planted to 15″ rows, under irrigation (July 17, 2017)

Figure 3. Apothecial Risk for soybeans planted to 30″ rows, under irrigation (July 17, 2017)

Map Legend: White = model is inactive and risk of apothecia in the field is likely low; Gray = apothecia might be present, but likelihood of apothecial presence is less than 5%; Blue = low risk of apothecia in the field (5 to <15% chance); Yellow = moderate risk of apothecia in the field (15 to <30% chance); Red = high risk of apothecia in the field (30% or higher chance). Model predictions must be combined with soybean growth stage and canopy characteristics to aid in timing of fungicide sprays.


These models were developed at the University of Wisconsin-Madison in conjunction with Michigan State University and Iowa State University to identify at-risk regions which have been experiencing weather favorable for the development of white mold fungus apothecia. Weather information and maps are provided by the Soybean Integrated Pest Information Platform for Extension and Education (iPIPE), which is managed by ZedX, Inc. This model predicts when apothecia will be present in the field using combinations of 30-day averages of maximum temperature, relative humidity, and maximum wind speed. Using virtually available weather data, predictions can be made in most soybean growing regions. Based on these predictions, a map is generated under three scenarios (non-irrigated soybeans, soybeans planted on 15″ row-spacing and irrigated, or soybeans planted on 30″ row-spacing and irrigated). The maps are colored to show the likelihood of apothecial presence within a region.  If the model is predicting high risk (red) in your area for your planting scenario, the soybeans are flowering, and the canopy is somewhat closed, then the white mold risk is elevated. If your fields are at-risk, we recommend to consult your local extension personnel or resources for the best in-season management options for your area For further information on how to use and interpret these risk maps, CLICK HERE to download a how-to guide.

Wisconsin White Mold Risk Maps – July 11, 2017

Damon L. Smith, Extension Field Crops Pathologist, University of Wisconsin-Madison

Jaime Willbur, Graduate Research Assistant, University of Wisconsin-Madison

Sclero-cast: A Soybean White Mold Prediction Model

**This tool is for guidance only and should be used with other sources of information and professional advice when determining risk of white mold development. We encourage you to read the model how-to guide which can be downloaded by clicking here**

Risk of apothecial presence and subsequent white mold development has remained steady since last week in non-irrigated fields (Fig. 1). Higher temperatures have offset higher moisture in these drylands situations to keep risk steady. Risk is highest for soybean fields in the west-central to northwest portions of Wisconsin. Risk is also high in a band stretching from south-central Wisconsin to northeast Wisconsin.

The greatest change in risk across the state is in soybeans under irrigation. A significant increase in areas of high risk is predicted in irrigated soybeans planted to 15-inch rows (Fig. 2). Many soybeans planted in this environment are highly likely to see white mold later in the season, if rows are currently closed and soybeans are blooming. Risk has also increased for soybeans under irrigation and planted in 30-inch rows (Fig. 3). Pockets of high risk exist in Jackson, Trempealeau, and Crawford counties if under irrigation and planted to 30-inch rows.

I expect risk to continue to remain high, or increase in some areas, if humidity remains high and timely rains fall. Continue to growth stage soybeans and note that map predictions should be considered for making white mold management decisions if soybeans are flowering and soybean canopies are nearly closed.  For more information on white mold and white mold management, see this previous post.

Figure 1. Apothecial Risk for non-irrigated soybean fields (July 11, 2017)

Figure 2. Apothecial Risk for soybeans planted to 15″ rows, under irrigation (July 11, 2017)

Figure 3. Apothecial Risk for soybeans planted to 30″ rows, under irrigation (July 11, 2017)

These models were developed at the University of Wisconsin-Madison in conjunction with Michigan State University and Iowa State University to identify at-risk regions which have been experiencing weather favorable for the development of white mold fungus apothecia. Weather information and maps are provided by the Soybean Integrated Pest Information Platform for Extension and Education (iPIPE), which is managed by ZedX, Inc. This model predicts when apothecia will be present in the field using combinations of 30-day averages of maximum temperature, relative humidity, and maximum wind speed. Using virtually available weather data, predictions can be made in most soybean growing regions. Based on these predictions, a map is generated under three scenarios (non-irrigated soybeans, soybeans planted on 15″ row-spacing and irrigated, or soybeans planted on 30″ row-spacing and irrigated). The maps are colored to show the likelihood of apothecial presence within a region. White areas indicate the model is inactive and risk of apothecia in the field is likely low. Gray areas indicate that apothecia might be present, but likelihood of apothecial presence is less than 5%. Blue indicates a low risk (5 to <15% chance), yellow a moderate risk (15 to <30% chance), and red areas indicate a high risk (30% or higher chance). Model predictions must be combined with soybean growth stage and canopy characteristics to aid in timing of fungicide sprays. If the model is predicting high risk (red) in your area for your planting scenario, the soybeans are flowering, and the canopy is somewhat closed, then the white mold risk is elevated. If your fields are at-risk, we recommend to consult your local extension personnel or resources for the best in-season management options for your area For further information on how to use and interpret these risk maps, CLICK HERE to download a how-to guide.