2017 UW Extension Pest Management Update Meeting Series

Be sure to get the latest field crop pest management updates, by attending the 2017 PMU Meetings!

Damon L. Smith, Extension Field Crops Pathologist, University of Wisconsin-Madison

Mark your calendars as the UW Extension’s Pest Management Update meetings are just around the corner (November 6-10). This year’s program will follow the same format as in 2016. Meetings will either be in the morning or afternoon and will run for 3 hours. Morning meetings will begin promptly at 9am and run to 12pm. Afternoon meetings will begin at 1pm and conclude at 4pm.

The full schedule with dates, meeting locations, and registration contact information are in the link below. Please register with the host agent at least 1 week prior to the meeting at the location you wish to attend.

Please attend the meeting location at which you registered. Each meeting in the series is a separate county-based event and host agents cannot interchange registrant fees or meal counts.

Three hours of Certified Crop Advisor CEU credits in pest management are requested for each session.

The speakers will be extension specialists Mark Renz, weed scientist, perennial cropping systems; Dan Heider, IPM outreach specialist, Bryan Jensen, entomologist, and Damon Smith, field crop pathologist.

2017 Pest Management Update Topics:

  • Integrated Pest Management Updates in corn, soybeans, alfalfa, and small grains: Update on new products and/or use of existing products as well as brief highlights of the 2017 pest situations in each crop.
  • Wisconsin herbicide resistance update by Mark Renz
  • In-depth weed diagnostic and management training by Mark Renz and Dan Heider

CHECK OUT THE FULL MEETING SCHEDULE BY CLICKING HERE!

Wisconsin White Mold Risk Maps – August 5, 2017

Jaime Willbur, Graduate Research Assistant, University of Wisconsin-Madison

Sclero-cast: A Soybean White Mold Prediction Model

**This tool is for guidance only and should be used with other sources of information and professional advice when determining risk of white mold development. We encourage you to read the model how-to guide which can be downloaded by clicking here**

Continued dry conditions over the past couple of weeks have helped to continue to decrease white mold risk in non-irrigated fields (Fig. 1). Some areas of high risk still exist in the southern and eastern portions of the state. However, many fields we have visited are moving to R3 and R4 growth stages. Thus, they are getting outside of the extremely critical period for infection by the white mold fungus. Some reports of symptoms of white mold are beginning to come in. I suspect we will begin to see more symptoms of disease over the next couple of weeks and will begin to get an understanding of how severe the epidemic will be this year.

Risk remains high for any soybeans planted to 15-inch rows AND irrigated (Fig. 2). This planting and management scenario is highly conducive for white mold development. We continue to find apothecia under irrigation and in 15-inch row-spacing. I would expect to see significantly higher levels of white mold in irrigated soybeans planted to 15-inch rows. Risk of white mold remained steady for soybeans planted to 30-inch rows and irrigated (Fig. 3). Risk remains high in the southwestern and western portions of Wisconsin for soybeans planted to 30-inch rows and irrigated (Fig. 3).

Forecasts indicate cool temperatures with chances of precipitation for the next week. I would expect white mold risk to hold steady. Continue to growth-stage soybeans and note that map predictions should be considered for making white mold management decisions if soybeans are flowering AND soybean canopies are nearly closed. We have visited fields all over the state and find soybeans well into the reproductive growth stages. We are quickly getting outside the window of opportunity to treat for white mold. Any remaining white mold management decisions should be made very soon. For more information on white mold and white mold management, see this previous post.

Figure 1. Apothecial Risk for non-irrigated soybean fields (August 5, 2017)

Figure 2. Apothecial Risk for soybeans planted to 15″ rows, under irrigation (August 5, 2017)

Figure 3. Apothecial Risk for soybeans planted to 30″ rows, under irrigation (August 5, 2017)

Map Legend: White = model is inactive and risk of apothecia in the field is likely low; Gray = apothecia might be present, but likelihood of apothecial presence is less than 5%; Blue = low risk of apothecia in the field (5 to <15% chance); Yellow = moderate risk of apothecia in the field (15 to <30% chance); Red = high risk of apothecia in the field (30% or higher chance). Model predictions must be combined with soybean growth stage and canopy characteristics to aid in timing of fungicide sprays.


These models were developed at the University of Wisconsin-Madison in conjunction with Michigan State University and Iowa State University to identify at-risk regions which have been experiencing weather favorable for the development of white mold fungus apothecia. Weather information and maps are provided by the Soybean Integrated Pest Information Platform for Extension and Education (iPIPE), which is managed by ZedX, Inc. This model predicts when apothecia will be present in the field using combinations of 30-day averages of maximum temperature, relative humidity, and maximum wind speed. Using virtually available weather data, predictions can be made in most soybean growing regions. Based on these predictions, a map is generated under three scenarios (non-irrigated soybeans, soybeans planted on 15″ row-spacing and irrigated, or soybeans planted on 30″ row-spacing and irrigated). The maps are colored to show the likelihood of apothecial presence within a region.  If the model is predicting high risk (red) in your area for your planting scenario, the soybeans are flowering, and the canopy is somewhat closed, then the white mold risk is elevated. If your fields are at-risk, we recommend to consult your local extension personnel or resources for the best in-season management options for your area For further information on how to use and interpret these risk maps, CLICK HERE to download a how-to guide.

Wisconsin White Mold Risk Maps – July 27, 2017

Jaime Willbur, Graduate Research Assistant, University of Wisconsin-Madison

Sclero-cast: A Soybean White Mold Prediction Model

**This tool is for guidance only and should be used with other sources of information and professional advice when determining risk of white mold development. We encourage you to read the model how-to guide which can be downloaded by clicking here**

Mostly dry conditions over the past week helped to decrease white mold risk in non-irrigated fields in many locations in the southern and south-central portion of the state (Fig. 1). However, risk remains high in the central area of the state and in portions of the far southern tier of counties.

Risk has increased substantially across the entire state for any soybeans planted to 15-inch rows AND irrigated (Fig. 2). This planting and management scenario is highly conducive for white mold development. We are finding increased numbers of apothecia under irrigation and in 15-inch row-spacing. Risk of white mold also increased slightly in the southwestern and western portions of Wisconsin for soybeans planted to 30-inch rows and irrigated (Fig. 3).

Forecasts indicate seasonable temperatures with little precipitation for the next week. This will give many of us a chance to dry out a bit from above-normal rainfall in July. I expect white mold risk to hold steady or decrease a bit given the forecasts. Continue to growth-stage soybeans and note that map predictions should be considered for making white mold management decisions if soybeans are flowering AND soybean canopies are nearly closed.  For more information on white mold and white mold management, see this previous post.

Figure 1. Apothecial Risk for non-irrigated soybean fields (July 27, 2017)

Figure 2. Apothecial Risk for soybeans planted to 15″ rows, under irrigation (July 27, 2017)

Figure 3. Apothecial Risk for soybeans planted to 30″ rows, under irrigation (July 27, 2017)

Map Legend: White = model is inactive and risk of apothecia in the field is likely low; Gray = apothecia might be present, but likelihood of apothecial presence is less than 5%; Blue = low risk of apothecia in the field (5 to <15% chance); Yellow = moderate risk of apothecia in the field (15 to <30% chance); Red = high risk of apothecia in the field (30% or higher chance). Model predictions must be combined with soybean growth stage and canopy characteristics to aid in timing of fungicide sprays.


These models were developed at the University of Wisconsin-Madison in conjunction with Michigan State University and Iowa State University to identify at-risk regions which have been experiencing weather favorable for the development of white mold fungus apothecia. Weather information and maps are provided by the Soybean Integrated Pest Information Platform for Extension and Education (iPIPE), which is managed by ZedX, Inc. This model predicts when apothecia will be present in the field using combinations of 30-day averages of maximum temperature, relative humidity, and maximum wind speed. Using virtually available weather data, predictions can be made in most soybean growing regions. Based on these predictions, a map is generated under three scenarios (non-irrigated soybeans, soybeans planted on 15″ row-spacing and irrigated, or soybeans planted on 30″ row-spacing and irrigated). The maps are colored to show the likelihood of apothecial presence within a region.  If the model is predicting high risk (red) in your area for your planting scenario, the soybeans are flowering, and the canopy is somewhat closed, then the white mold risk is elevated. If your fields are at-risk, we recommend to consult your local extension personnel or resources for the best in-season management options for your area For further information on how to use and interpret these risk maps, CLICK HERE to download a how-to guide.

Wisconsin White Mold Risk Maps – July 21, 2017

Damon L. Smith, Extension Field Crops Pathologist, University of Wisconsin-Madison

Jaime Willbur, Graduate Research Assistant, University of Wisconsin-Madison

Sclero-cast: A Soybean White Mold Prediction Model

**This tool is for guidance only and should be used with other sources of information and professional advice when determining risk of white mold development. We encourage you to read the model how-to guide which can be downloaded by clicking here**

Higher average temperatures this week helped to decrease white mold risk in non-irrigated fields in some locations in the southern and south-central portion of the state (Fig. 1). However, risk remains high in the central area of the state and in portions of the western region.

Areas of high risk have increased in irrigated soybeans planted to 15-inch rows (Fig. 2). Soybeans planted to 15-inch rows and irrigated are under high risk for white mold development in much of the state of Wisconsin. This is consistent with our field observations. Our crew has mostly found apothecia (the small, cup-shaped mushroom) in fields that are irrigated and planted to the 15″ row-spacing. Risk of white mold increased slightly in several pockets along the Wisconsin River Valley and in Jackson and Trempealeau Counties for soybeans planted to 30-inch rows and irrigated (Fig. 3).

Forecasts indicate cooler weather next week. This may increase risk further in some areas, depending on where dew and rain events occur. Continue to growth-stage soybeans and note that map predictions should be considered for making white mold management decisions if soybeans are flowering AND soybean canopies are nearly closed.  For more information on white mold and white mold management, see this previous post.

Figure 1. Apothecial Risk for non-irrigated soybean fields (July 21, 2017)

Figure 2. Apothecial Risk for soybeans planted to 15″ rows, under irrigation (July 21, 2017)

Figure 3. Apothecial Risk for soybeans planted to 30″ rows, under irrigation (July 21, 2017)

Map Legend: White = model is inactive and risk of apothecia in the field is likely low; Gray = apothecia might be present, but likelihood of apothecial presence is less than 5%; Blue = low risk of apothecia in the field (5 to <15% chance); Yellow = moderate risk of apothecia in the field (15 to <30% chance); Red = high risk of apothecia in the field (30% or higher chance). Model predictions must be combined with soybean growth stage and canopy characteristics to aid in timing of fungicide sprays.


These models were developed at the University of Wisconsin-Madison in conjunction with Michigan State University and Iowa State University to identify at-risk regions which have been experiencing weather favorable for the development of white mold fungus apothecia. Weather information and maps are provided by the Soybean Integrated Pest Information Platform for Extension and Education (iPIPE), which is managed by ZedX, Inc. This model predicts when apothecia will be present in the field using combinations of 30-day averages of maximum temperature, relative humidity, and maximum wind speed. Using virtually available weather data, predictions can be made in most soybean growing regions. Based on these predictions, a map is generated under three scenarios (non-irrigated soybeans, soybeans planted on 15″ row-spacing and irrigated, or soybeans planted on 30″ row-spacing and irrigated). The maps are colored to show the likelihood of apothecial presence within a region.  If the model is predicting high risk (red) in your area for your planting scenario, the soybeans are flowering, and the canopy is somewhat closed, then the white mold risk is elevated. If your fields are at-risk, we recommend to consult your local extension personnel or resources for the best in-season management options for your area For further information on how to use and interpret these risk maps, CLICK HERE to download a how-to guide.

Wisconsin White Mold Risk Maps – July 17, 2017

Damon L. Smith, Extension Field Crops Pathologist, University of Wisconsin-Madison

Jaime Willbur, Graduate Research Assistant, University of Wisconsin-Madison

Sclero-cast: A Soybean White Mold Prediction Model

**This tool is for guidance only and should be used with other sources of information and professional advice when determining risk of white mold development. We encourage you to read the model how-to guide which can be downloaded by clicking here**

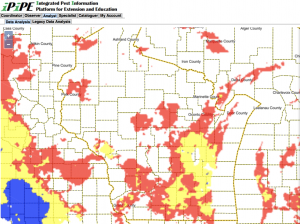
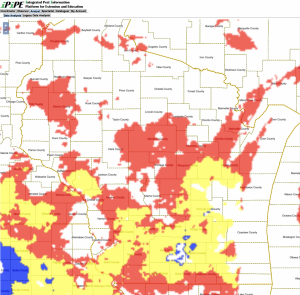
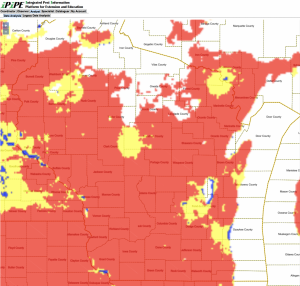
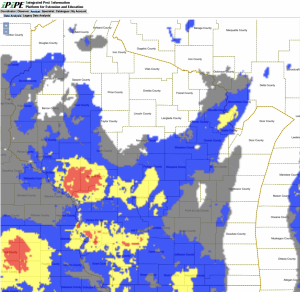
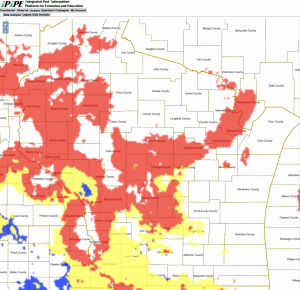
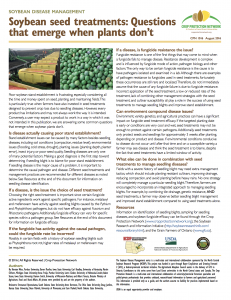
Risk of apothecial presence and subsequent white mold development has increased over the past week in non-irrigated fields (Fig. 1). Cool temperatures and high moisture have increased risk to high levels especially along the southern tier of counties, and into Dodge and Fond du Lac counties. Risk remains high in west-central to northwest portions of Wisconsin and in a band stretching from south-central Wisconsin to northeast Wisconsin.

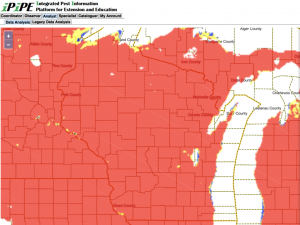
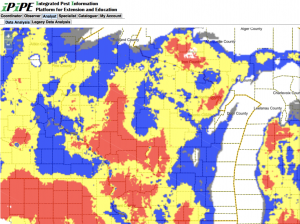
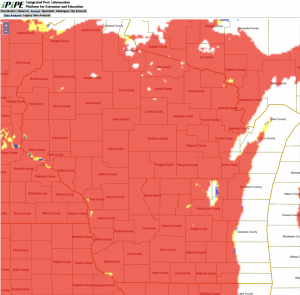
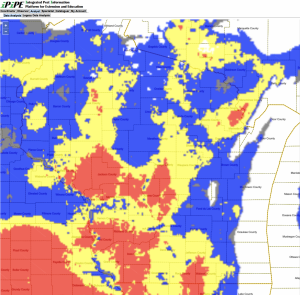
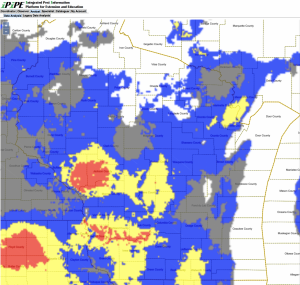
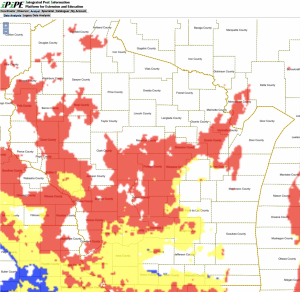
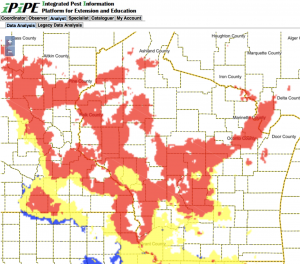
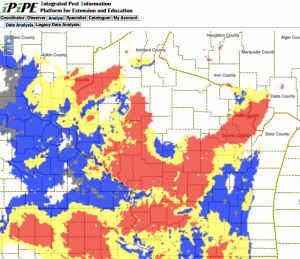
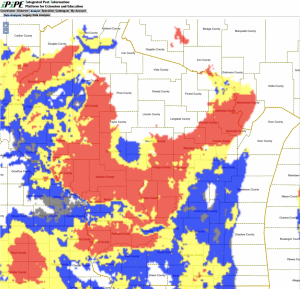
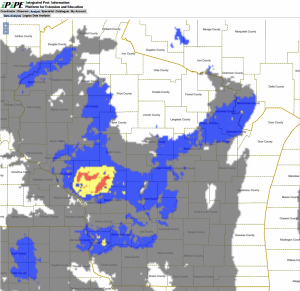
Areas of high risk have remained steady in irrigated soybeans planted to 15-inch rows (Fig. 2) and 30-inch rows (Fig. 3). Soybeans planted to 15-inch rows and irrigated are under high risk for white mold development in the southern region west-central region and in a band stretching from central to northeast Wisconsin. Risk in irrigated soybeans planted to 30-inch row spacing remains low to moderate.

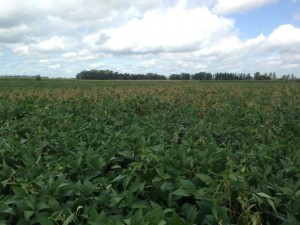
The Field Crops Pathology crew has also started scouting commercial fields, and research plots, for apothecia. Consistent with the models, we have found apothecia under irrigation on the central sands. We did not find apothecia in dryland environments in the southern tier of the state, where there was low-to-moderate risk expected.

I expect risk to continue to remain steady over the next week, as heat will be accompanied by frequent rain events. Continue to growth-stage soybeans and note that map predictions should be considered for making white mold management decisions if soybeans are flowering AND soybean canopies are nearly closed.  For more information on white mold and white mold management, see this previous post.

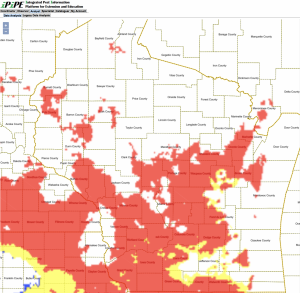
Figure 1. Apothecial Risk for non-irrigated soybean fields (July 17, 2017)

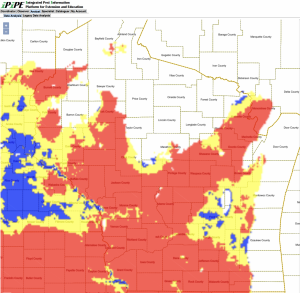
Figure 2. Apothecial Risk for soybeans planted to 15″ rows, under irrigation (July 17, 2017)

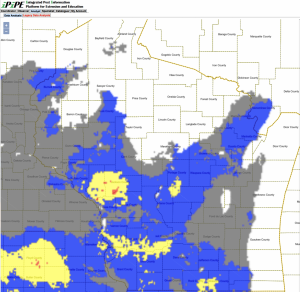
Figure 3. Apothecial Risk for soybeans planted to 30″ rows, under irrigation (July 17, 2017)

Map Legend: White = model is inactive and risk of apothecia in the field is likely low; Gray = apothecia might be present, but likelihood of apothecial presence is less than 5%; Blue = low risk of apothecia in the field (5 to <15% chance); Yellow = moderate risk of apothecia in the field (15 to <30% chance); Red = high risk of apothecia in the field (30% or higher chance). Model predictions must be combined with soybean growth stage and canopy characteristics to aid in timing of fungicide sprays.


These models were developed at the University of Wisconsin-Madison in conjunction with Michigan State University and Iowa State University to identify at-risk regions which have been experiencing weather favorable for the development of white mold fungus apothecia. Weather information and maps are provided by the Soybean Integrated Pest Information Platform for Extension and Education (iPIPE), which is managed by ZedX, Inc. This model predicts when apothecia will be present in the field using combinations of 30-day averages of maximum temperature, relative humidity, and maximum wind speed. Using virtually available weather data, predictions can be made in most soybean growing regions. Based on these predictions, a map is generated under three scenarios (non-irrigated soybeans, soybeans planted on 15″ row-spacing and irrigated, or soybeans planted on 30″ row-spacing and irrigated). The maps are colored to show the likelihood of apothecial presence within a region.  If the model is predicting high risk (red) in your area for your planting scenario, the soybeans are flowering, and the canopy is somewhat closed, then the white mold risk is elevated. If your fields are at-risk, we recommend to consult your local extension personnel or resources for the best in-season management options for your area For further information on how to use and interpret these risk maps, CLICK HERE to download a how-to guide.

Wisconsin White Mold Risk Maps – July 11, 2017

Damon L. Smith, Extension Field Crops Pathologist, University of Wisconsin-Madison

Jaime Willbur, Graduate Research Assistant, University of Wisconsin-Madison

Sclero-cast: A Soybean White Mold Prediction Model

**This tool is for guidance only and should be used with other sources of information and professional advice when determining risk of white mold development. We encourage you to read the model how-to guide which can be downloaded by clicking here**

Risk of apothecial presence and subsequent white mold development has remained steady since last week in non-irrigated fields (Fig. 1). Higher temperatures have offset higher moisture in these drylands situations to keep risk steady. Risk is highest for soybean fields in the west-central to northwest portions of Wisconsin. Risk is also high in a band stretching from south-central Wisconsin to northeast Wisconsin.

The greatest change in risk across the state is in soybeans under irrigation. A significant increase in areas of high risk is predicted in irrigated soybeans planted to 15-inch rows (Fig. 2). Many soybeans planted in this environment are highly likely to see white mold later in the season, if rows are currently closed and soybeans are blooming. Risk has also increased for soybeans under irrigation and planted in 30-inch rows (Fig. 3). Pockets of high risk exist in Jackson, Trempealeau, and Crawford counties if under irrigation and planted to 30-inch rows.

I expect risk to continue to remain high, or increase in some areas, if humidity remains high and timely rains fall. Continue to growth stage soybeans and note that map predictions should be considered for making white mold management decisions if soybeans are flowering and soybean canopies are nearly closed.  For more information on white mold and white mold management, see this previous post.

Figure 1. Apothecial Risk for non-irrigated soybean fields (July 11, 2017)

Figure 2. Apothecial Risk for soybeans planted to 15″ rows, under irrigation (July 11, 2017)

Figure 3. Apothecial Risk for soybeans planted to 30″ rows, under irrigation (July 11, 2017)

These models were developed at the University of Wisconsin-Madison in conjunction with Michigan State University and Iowa State University to identify at-risk regions which have been experiencing weather favorable for the development of white mold fungus apothecia. Weather information and maps are provided by the Soybean Integrated Pest Information Platform for Extension and Education (iPIPE), which is managed by ZedX, Inc. This model predicts when apothecia will be present in the field using combinations of 30-day averages of maximum temperature, relative humidity, and maximum wind speed. Using virtually available weather data, predictions can be made in most soybean growing regions. Based on these predictions, a map is generated under three scenarios (non-irrigated soybeans, soybeans planted on 15″ row-spacing and irrigated, or soybeans planted on 30″ row-spacing and irrigated). The maps are colored to show the likelihood of apothecial presence within a region. White areas indicate the model is inactive and risk of apothecia in the field is likely low. Gray areas indicate that apothecia might be present, but likelihood of apothecial presence is less than 5%. Blue indicates a low risk (5 to <15% chance), yellow a moderate risk (15 to <30% chance), and red areas indicate a high risk (30% or higher chance). Model predictions must be combined with soybean growth stage and canopy characteristics to aid in timing of fungicide sprays. If the model is predicting high risk (red) in your area for your planting scenario, the soybeans are flowering, and the canopy is somewhat closed, then the white mold risk is elevated. If your fields are at-risk, we recommend to consult your local extension personnel or resources for the best in-season management options for your area For further information on how to use and interpret these risk maps, CLICK HERE to download a how-to guide.

Wisconsin White Mold Risk Maps – July 4, 2017

Damon L. Smith, Extension Field Crops Pathologist, University of Wisconsin-Madison

Jaime Willbur, Graduate Research Assistant, University of Wisconsin-Madison

Sclero-cast: A Soybean White Mold Prediction Model

**This tool is for guidance only and should be used with other sources of information and professional advice when determining risk of white mold development. We encourage you to read the model how-to guide which can be downloaded by clicking here**

Risk of apothecial presence and subsequent white mold development has increased very slightly since the last posting. Currently, risk is highest for soybean fields in the west-central to northwest portions of Wisconsin. Risk is also high in a band stretching from south-central Wisconsin to northeast Wisconsin. Risk is further elevated in fields planted to 15″ row-spacing and/or irrigated. Early-planted soybean fields are likely beginning to flowering, these risk models should be monitored frequently to assist in making in-season fungicide application decisions during the soybean bloom period. For more information on white mold and white mold management, see this previous post.

Apothecial Risk for non-irrigated soybean fields (July 4, 2017)

Apothecial Risk for soybeans planted to 15″ row-spacing, under irrigation (July 4, 2017)

Apothecial Risk for soybeans planted to 30″ row-spacing, under irrigation (July 4, 2017)

These models were developed at the University of Wisconsin-Madison in conjunction with Michigan State University and Iowa State University to identify at-risk regions which have been experiencing weather favorable for the development of white mold fungus apothecia. Weather information and maps are provided by the Soybean Integrated Pest Information Platform for Extension and Education (iPIPE), which is managed by ZedX, Inc. This model predicts when apothecia will be present in the field using combinations of 30-day averages of maximum temperature, relative humidity, and maximum wind speed. Using virtually available weather data, predictions can be made in most soybean growing regions. Based on these predictions, a map is generated under three scenarios (non-irrigated soybeans, soybeans planted on 15″ row-spacing and irrigated, or soybeans planted on 30″ row-spacing and irrigated). The maps are colored to show the likelihood of apothecial presence within a region. White areas indicate the model is inactive and risk of apothecia in the field is likely low. Gray areas indicate that apothecia might be present, but likelihood of apothecial presence is less than 5%. Blue indicates a low risk (5 to <15% chance), yellow a moderate risk (15 to <30% chance), and red areas indicate a high risk (30% or higher chance). Model predictions must be combined with soybean growth stage and canopy characteristics to aid in timing of fungicide sprays. If the model is predicting high risk (red) in your area for your planting scenario, the soybeans are flowering, and the canopy is somewhat closed, then the white mold risk is elevated. If your fields are at-risk, we recommend to consult your local extension personnel or resources for the best in-season management options for your area For further information on how to use and interpret these risk maps, CLICK HERE to download a how-to guide.

Wisconsin White Mold Risk Maps – June 30, 2017

Damon L. Smith, Extension Field Crops Pathologist, University of Wisconsin-Madison

Jaime Willbur, Graduate Research Assistant, University of Wisconsin-Madison

Sclero-cast: A Soybean White Mold Prediction Model

**This tool is for guidance only and should be used with other sources of information and professional advice when determining risk of white mold development. We encourage you to read the model how-to guide which can be downloaded by clicking here**

Risk of apothecial presence and subsequent white mold development is currently highest for soybean fields in the west-central to northwest portions of Wisconsin. Risk is further elevated in fields planted to 15″ row-spacing and/or irrigated. While many soybean fields are likely not flowering yet, these risk models should be monitored closely to assist in making in-season fungicide application decisions during the soybean bloom period. For more information on white mold and white mold management, see this previous post.

Apothecial Risk for non-irrigated soybean fields (June 30, 2017)

Apothecial Risk for soybeans planted to 15″ row-spacing, under irrigation

Apothecial Risk for soybeans planted to 30″ row-spacing, under irrigation

This model was developed at the University of Wisconsin-Madison in conjunction with Michigan State University and Iowa State University to identify at-risk regions which have been experiencing weather favorable for the development of white mold fungus apothecia. Weather information and maps are provided by the Soybean Integrated Pest Information Platform for Extension and Education (iPIPE), which is managed by ZedX, Inc. This model predicts when apothecia will be present in the field using combinations of 30-day averages of maximum temperature, relative humidity, and maximum wind speed. Using virtually available weather data, predictions can be made in most soybean growing regions. Based on these predictions, a map is generated under three scenarios (non-irrigated soybeans, soybeans planted on 15″ row-spacing and irrigated, or soybeans planted on 30″ row-spacing and irrigated). The maps are colored to show the likelihood of apothecial presence within a region. White areas indicate the model is inactive and risk of apothecia in the field is likely low. Gray areas indicate that apothecia might be present, but likelihood of apothecial presence is less than 5%. Blue indicates a low risk (5 to <15% chance), yellow a moderate risk (15 to <30% chance), and red areas indicate a high risk (30% or higher chance). Model predictions must be combined with soybean growth stage and canopy characteristics to aid in timing of fungicide sprays. If the model is predicting high risk (red) in your area for your planting scenario, the soybeans are flowering, and the canopy is somewhat closed, then the white mold risk is elevated. If your fields are at-risk, we recommend to consult your local extension personnel or resources for the best in-season management options for your area For further information on how to use and interpret these risk maps, CLICK HERE to download a how-to guide.

Time to Start Preparing for White Mold Management in Soybean

Damon L. Smith, Extension Field Crops Pathologist, University of Wisconsin-Madison

Jaime Willbur, Graduate Research Assistant, University of Wisconsin-Madison

Damage from white mold in a soybean field under irrigation.

While many struggled to plant soybeans due to extremely wet weather this season, many fields we have observed are looking quite good. Soybeans planted in early May in the southwest portion of Wisconsin, may be flowering, or approaching the flowering growth stage. The flowering growth stages are a critical time to manage white mold, in-season. You can visit my previous posts dealing with white mold and favorable conditions, or view a fact sheet or video on the subject.

As you probably know, timing in-season fungicide sprays at the correct time during the soybean bloom period can be extremely difficult. To help solve this decision-making issue, a model was developed at the University of Wisconsin-Madison in conjunction with Michigan State University and Iowa State University to identify at-risk regions which have been experiencing weather favorable for the development of white mold apothecia. This model predicts when apothecia will be present in the field using combinations of 30-day averages of maximum temperature, relative humidity, and wind speed. Using virtually available weather data, predictions can be made in most soybean growing regions. Based on these predictions, a map is generated under three scenarios (non-irrigated soybeans, soybeans planted on 15″ row-spacing and irrigated, or soybeans planted on 30″ row-spacing and irrigated). The maps are colored to show the likelihood of apothecial presence within a region. White areas indicate the model is inactive and risk of apothecia in the field is likely low. Gray areas indicate that apothecia might be present, but likelihood of apothecial presence is less than 5%. Blue indicates a low risk (5 to <15% chance), yellow a moderate risk (15 to <30% chance), and red areas indicate a high risk (30% or higher chance). Model predictions must be combined with soybean growth stage and canopy characteristics to aid in timing of fungicide sprays. If the model is predicting high risk (red) in your area for your planting scenario, the soybeans are flowering, and the canopy is somewhat closed, then the white mold risk is elevated. If your fields are at-risk, we recommend to consult your local extension personnel or resources for the best in-season management options for your area. To view and download a handy user guide for the model, CLICK HERE.

For Wisconsin soybean growers, regular updates and commentary regarding risk of white mold can be found on this blog. Color coded, state-wide maps will be posted and our recommendations will accompany these posts. So be sure to check back regularly or subscribe to the blog to receive an automatic e-mail update when a new post has been added. You can subscribe via the window immediately to the right of this window. The first post for 2017 can be viewed by clicking here

If you have decided to spray soybeans for white mold, what are the best products to use? Over the last several years we have run numerous fungicide efficacy trials in Wisconsin and in conjunction with researchers in other states. Fungicides that have performed well in multi-state studies can be found in the 2017 version of the Soybean Fungicide Efficacy Table. In Wisconsin, we have observed that Endura applied at 8 oz at the R1 growth stage performs well. We have also observed that the fungicide Aproach applied at 9 fl oz at R1 and again at R3 also performs comparably to the Endura treatment. Other fungicide options also include Omega and Proline. You can view results of past fungicide evaluations by CLICKING HERE.

For even more detailed information about white mold you can visit the Crop Protection Network page on white mold . You can also find more information about white mold by clicking here and scrolling down to the white mold section.

Scouting for Soybean Seedling Diseases

Damon Smith, Extension Field Crops Pathologist, Department of Plant Pathology, University of Wisconsin-Madison

The 2017 planting season has been frustrating for many farmers with frequent rains, wet soils, and cool temperatures. These conditions have resulted in slow, or no planting, for some farmers. To add insult to injury, these conditions are also conducive for many seedling diseases of soybean. The Crop Protection Network, which the UW Field Crops Pathology program is a part of, has generated several useful publications for diagnosing and managing soybean seedling diseases.

The first publication is a full length fact sheet titled “Soybean Seedling Diseases.” This publication can help you differentiate seedling diseases and also herbicide injury, both of which could be issues for many farmers this season.

Speaking of herbicide issues, the CPN has also generated a useful publication on using ILeVO® seed treatment on soybean. Many farmers in Wisconsin have considering using ILeVO® to manage sudden death syndrome and soybean cyst nematode. Farmers should be aware that it is well known that ILeVO® can cause some phytotoxicity to soybean that looks similar to a soybean seedling disease. A useful fact sheet on this phenomenon can be found by clicking here.

Many farmers have elected to use a seed treatment (fungicide, insecticide, nematicide or combination) to protect their seed investment. This is a wise decision, especially considering the cool wet soils that many of us have planted into this season. However, just because a seed treatment was used, there still can be emergence issues. To aid in understanding these issues, the CPN has generated a “Soybean Seed Treatments: Questions that emerge when plants don’t.

Finally, if conditions remain wet, Phytopthora root and stem rot may affect soybean stands early to mid-season. The CPN has developed a resource which can be found by clicking here. The UW Field Crops Pathology program has also generated a similar fact sheet on Phytopthora root and stem rot that can be found by clicking here.

As always, if you have questions about diseases of soybean, or any field crop, please contact and we can assist in diagnosing and developing a management strategy.