Damon Smith, Extension Field Crops Pathologist, University of Wisconsin-Madison
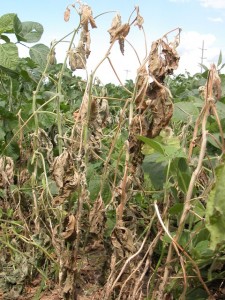
Wilting and plant death as a result of Sclerotinia stem rot. Photo Credit: Craig Grau.
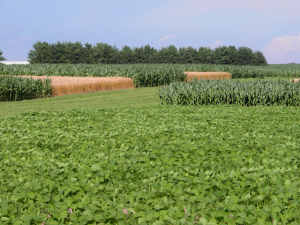
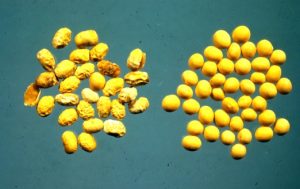
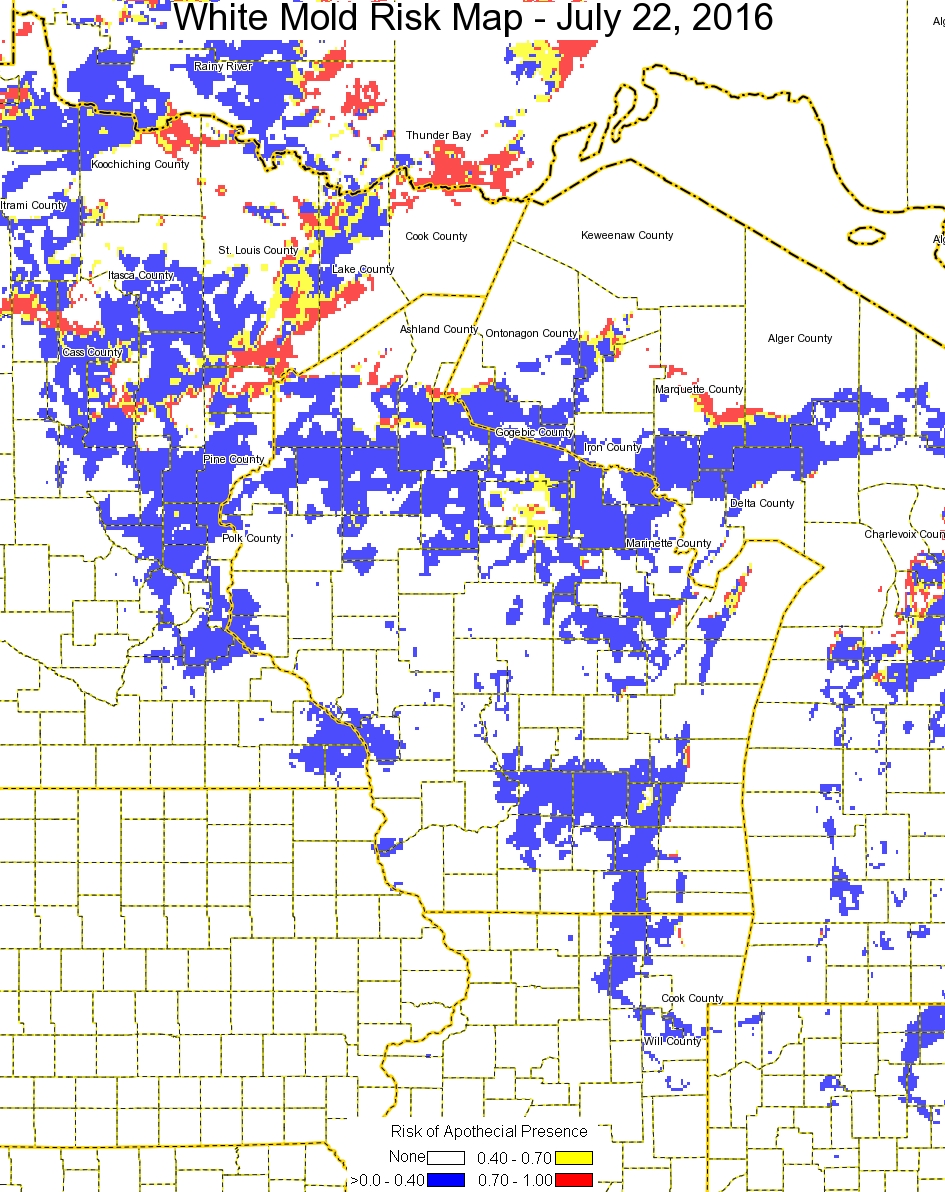
The UW Fields Crops Pathology team has begun to scout for white mold symptoms in soybean fields around the state. Generally white mold incidence has been relatively light in fields we have visited in the southern half of the state. Some pockets of higher incidence do exist, but pressure has been generally low.
Incidence in the northern half of the state is higher. We have visited fields as far north as Bloomer, Wisconsin and have observed incidence ranging from 3% to 20% of plants infected. Reports from areas in the northwest and northeast also confirm similar findings. Most of the soybean crop is at the R5 growth stage, with some earlier maturing fields approaching R6. Questions have arisen about spraying fungicide now to reduce the damage caused by white mold and preserve yield. The short answer is NO. The reason is that the primary means of infection by the white mold fungus is through soybean flowers. These infections happened several weeks ago. Therefore, the optimal time to spray would be when flowers were out. A low level of plant-to-plant transmission can occur late in the season in soybeans. However, this rate is low enough, that spraying to prevent it does not produce favorable results.
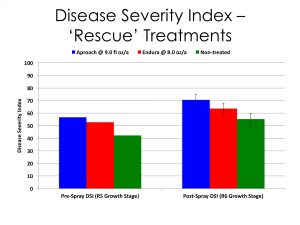
Figure 1. White mold severity index ratings for soybeans treated with or without fungicide at the R5 growth stage.
In 2014 we conducted a trial where we applied the fungicide Aproach and Endura to soybeans already showing symptoms of white mold and compared these treatments to a non-treated check. These were plots in a production field. We rated them for severity at the time of application and then again 2 weeks later. We also collected yield data.
Aproach and Endura both have good efficacy on white mold when they are applied at the right time. However when applied late (R5 growth stage), like we did in this trial, we noticed no ability of these products to reduce disease advancement. Figure 1 shows the disease severity index ratings of the two treatments compared to the non-treated check. On the left are the pre-spray ratings and on the right are the post-application ratings. All treatments resulted in basically an equal increase in disease. Figure 2 shows the average yield for each treatment. You will notice that there is no statistical separation in yield, with only about a 2 bushel difference among treatments. In fact the yield for all treatments was equally low. There was no response out of these fungicides at this late application timing. Had the timing been appropriate (R1 to R3 growth stages) then we might expect a greater than 10 bushel response out of Aproach and Endura.
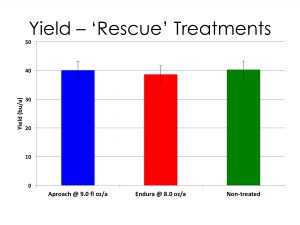
Figure 2. Yield of white mold-symptomatic soybeans treated with fungicide at the R5 growth stage or not treated.
How much soybean yield might I lose from white mold?
Research has demonstrated that for every 10% increase in the number of plants that are infected with white mold at the R7 growth stage, you can expect between 2 to 5 bushels of yield loss. Thus, the fields I mentioned earlier will likely range from little detectable yield loss (3% incidence) to as high as 10 bushels lost (20% incidence).
What should I do if I see white mold in my soybean field now?
Get out and survey your fields for white mold. It is a good idea to determine how much white mold you have in your fields, so you can make some educated harvest decisions. One way to move white mold from one field to the next is via combines. You could clean your combine between each field, but this can be time consuming. So my determining which fields have no white mold and which fields have the most white mold, you can develop a logical harvest order by beginning your harvest on fields with no white mold and working your way to the heavily infested fields. This will help reduce spread of the white mold fungus to fields that aren’t infested. You can also make some decisions on your rotation plan and future soybean variety choices based on these late season observations.
If you would like to learn more about white mold and management of this disease, CLICK HERE to download a fact sheet from the crop protection network. You can also watch a short video about white mold by CLICKING HERE.