
Wisconsin White Mold Risk Maps – July 27, 2017
Jaime Willbur, Graduate Research Assistant, University of Wisconsin-Madison
Sclero-cast: A Soybean White Mold Prediction Model
**This tool is for guidance only and should be used with other sources of information and professional advice when determining risk of white mold development. We encourage you to read the model how-to guide which can be downloaded by clicking here**
Mostly dry conditions over the past week helped to decrease white mold risk in non-irrigated fields in many locations in the southern and south-central portion of the state (Fig. 1). However, risk remains high in the central area of the state and in portions of the far southern tier of counties.
Risk has increased substantially across the entire state for any soybeans planted to 15-inch rows AND irrigated (Fig. 2). This planting and management scenario is highly conducive for white mold development. We are finding increased numbers of apothecia under irrigation and in 15-inch row-spacing. Risk of white mold also increased slightly in the southwestern and western portions of Wisconsin for soybeans planted to 30-inch rows and irrigated (Fig. 3).
Forecasts indicate seasonable temperatures with little precipitation for the next week. This will give many of us a chance to dry out a bit from above-normal rainfall in July. I expect white mold risk to hold steady or decrease a bit given the forecasts. Continue to growth-stage soybeans and note that map predictions should be considered for making white mold management decisions if soybeans are flowering AND soybean canopies are nearly closed. For more information on white mold and white mold management, see this previous post.
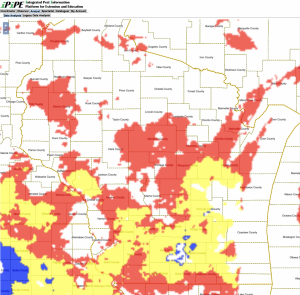 Figure 1. Apothecial Risk for non-irrigated soybean fields (July 27, 2017) |
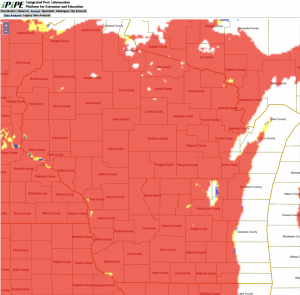 Figure 2. Apothecial Risk for soybeans planted to 15″ rows, under irrigation (July 27, 2017) |
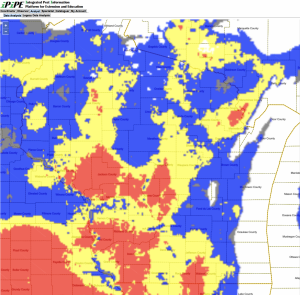 Figure 3. Apothecial Risk for soybeans planted to 30″ rows, under irrigation (July 27, 2017) |
Map Legend: White = model is inactive and risk of apothecia in the field is likely low; Gray = apothecia might be present, but likelihood of apothecial presence is less than 5%; Blue = low risk of apothecia in the field (5 to <15% chance); Yellow = moderate risk of apothecia in the field (15 to <30% chance); Red = high risk of apothecia in the field (30% or higher chance). Model predictions must be combined with soybean growth stage and canopy characteristics to aid in timing of fungicide sprays.
These models were developed at the University of Wisconsin-Madison in conjunction with Michigan State University and Iowa State University to identify at-risk regions which have been experiencing weather favorable for the development of white mold fungus apothecia. Weather information and maps are provided by the Soybean Integrated Pest Information Platform for Extension and Education (iPIPE), which is managed by ZedX, Inc. This model predicts when apothecia will be present in the field using combinations of 30-day averages of maximum temperature, relative humidity, and maximum wind speed. Using virtually available weather data, predictions can be made in most soybean growing regions. Based on these predictions, a map is generated under three scenarios (non-irrigated soybeans, soybeans planted on 15″ row-spacing and irrigated, or soybeans planted on 30″ row-spacing and irrigated). The maps are colored to show the likelihood of apothecial presence within a region. If the model is predicting high risk (red) in your area for your planting scenario, the soybeans are flowering, and the canopy is somewhat closed, then the white mold risk is elevated. If your fields are at-risk, we recommend to consult your local extension personnel or resources for the best in-season management options for your area For further information on how to use and interpret these risk maps, CLICK HERE to download a how-to guide.