
The Effect of Tar Spot on Corn Hybrids in Wisconsin in 2018
Damon Smith, Department of Plant Pathology, University of Wisconsin-Madison
Brian Mueller, Department of Plant Pathology, University of Wisconsin-Madison
Joe Lauer, Department of Agronomy, University of Wisconsin-Madison
Kent Kohn, Department of Agronomy, University of Wisconsin-Madison
Thierno Diallo, Department of Agronomy, University of Wisconsin-Madison

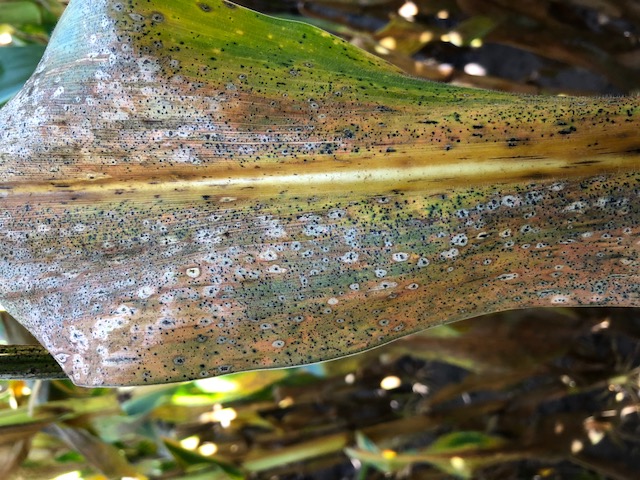
Tar Spot signs and symptoms on a corn leaf
If you are like me, you are probably wishing 2018 would just go ahead and get it over with. It was a challenging year for farmers, practitioners, and extension personnel. This fall and winter has been consumed with questions and meetings trying to evaluate all of the disease issues of 2018, especially on corn. The topic of main concern has been tar spot and what the data are telling us in terms of managing this problem moving forward. I’m not going to re-hash what tar spot is and what causes it here. If you want to know more about the disease, you can read my previous post on the subject or watch my short video. I will say that the epidemic was significant and in some locations in Wisconsin, hit yields reasonably hard. I am getting a number of questions about hybrid resistance to tar spot. Is there any? What hybrids are resistant? Well, let’s take a look at a little data.
The Hybrid Performance Trials
The epicenter of the 2018 epidemic in Wisconsin was definitely in the Southwestern part of the state. Areas around Cuba City to Platteville were hit hard and early. As part of the Wisconsin Hybrid Performance Trials a test plot was evaluated for tar spot near Montfort, WI. Details of the implementation, data acquisition and other information pertaining to the Wisconsin Hybrid Performance Trials can be found by clicking here. In addition to the data that was described there, we evaluated tar spot severity and canopy greenness and related that information to grain yield. Those data are below.
Acquiring the Data
Disease ratings for this location were performed on two dates. For the early (98-106 day) relative maturity (RM) trial we rated tar spot severity on the ear leaves on 8/31/2018. For the late RM trial (104-113 day) we rated tar spot severity on 9/4/2018. In addition to taking tar spot data, we also determined the canopy greenness as the relative percentage of canopy still green on that rating date. Many have observed that as tar spot severity increased, corn plants tended to dry faster. The greenness score was meant to understand the level of senescence relative to the tar spot severity level. Yield was determined as described in the details of the hybrid performance trials. We then used standard mixed-model analysis of variance to determine differences in tar spot severity, canopy greening, and yield. We also looked at the relationship of tar spot severity to yield using linear regression. This latter analysis was meant to understand the yield reductions relative to the tar spot severity across hybrids at this location.
The Results
For both the early RM trial (Figure 1) and the late RM trial (Figure 2) there were significant differences in tar spot severity among hybrids tested.
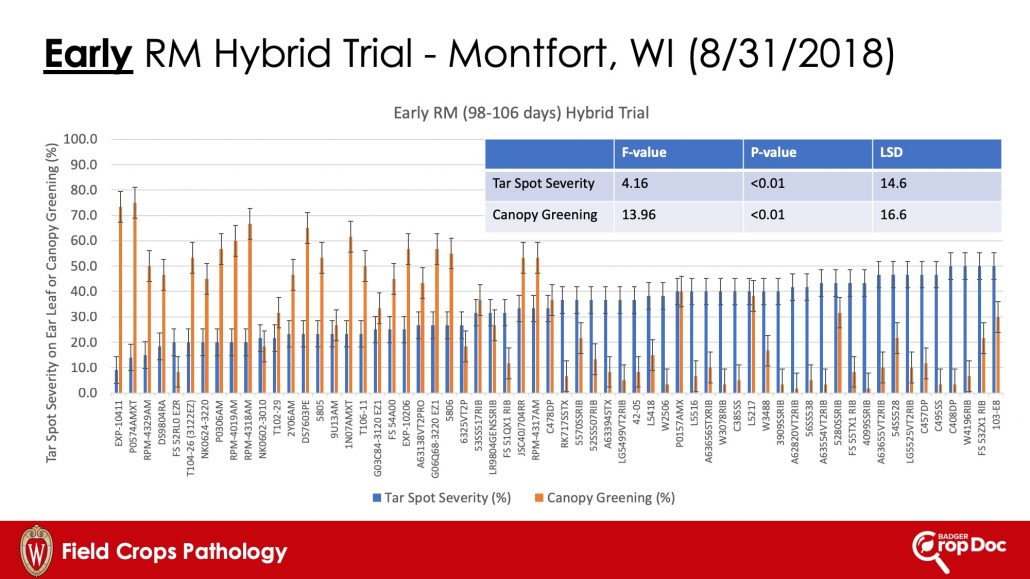
Figure 1. Tar Spot Severity and canopy greenness for early RM hybrids at Montfort, WI in 2018.
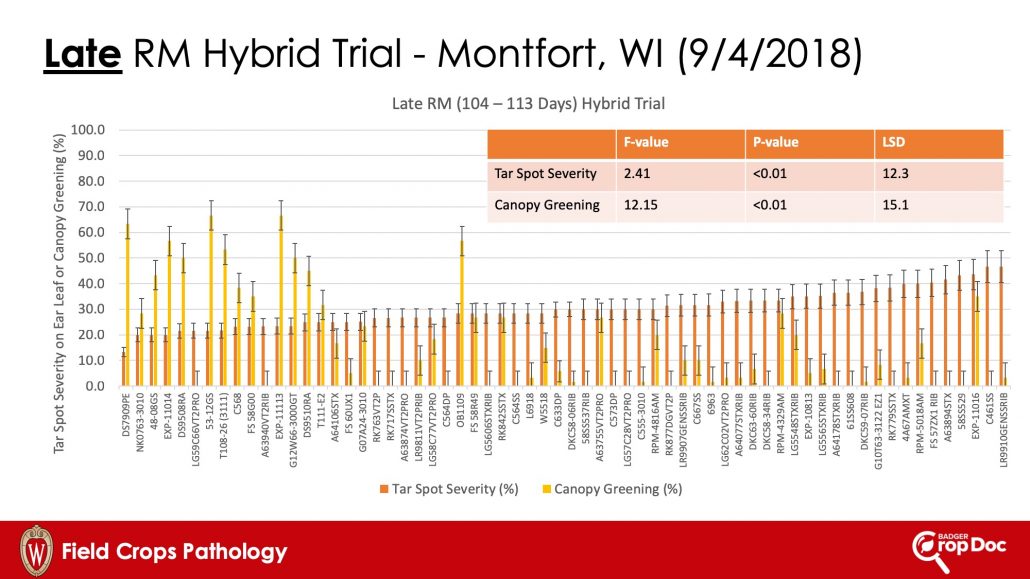
Figure 2. Tar Spot Severity and canopy greenness for late RM hybrids at Montfort, WI in 2018.
Some hybrids do appear to be relatively resistant with severity ratings averaging 10-20%. However, other hybrids seems quite susceptible with severity ratings near 50%. No particular brand had hybrids that were more resistant than the other brand. Each hybrid varied in its level of resistance within brand. Also, note that no hybrid was completely devoid of disease. There appears to be no complete resistance to tar spot, but definitely some partial resistance in some hybrids.
Canopy greenness was generally negatively correlated with increasing tar spot severity. What was interesting is that as tar spot severity (area of the ear leaf covered by tar spot, spots) increased to 50%, canopy greenness often fell almost to 0%! Indeed, tar spot does seem to induce early senescence, especially in hybrids that aren’t as resistant.
Figures 3 and 4 show yield data from both the early RM (Figure 3) and late RM (Figure 4) trials for each of the same hybrids from the figures above. Hybrids are in the same order, and in both cases, there does seem to be some general yield reduction from low tar spot severity to high tar spot severity. But how much?
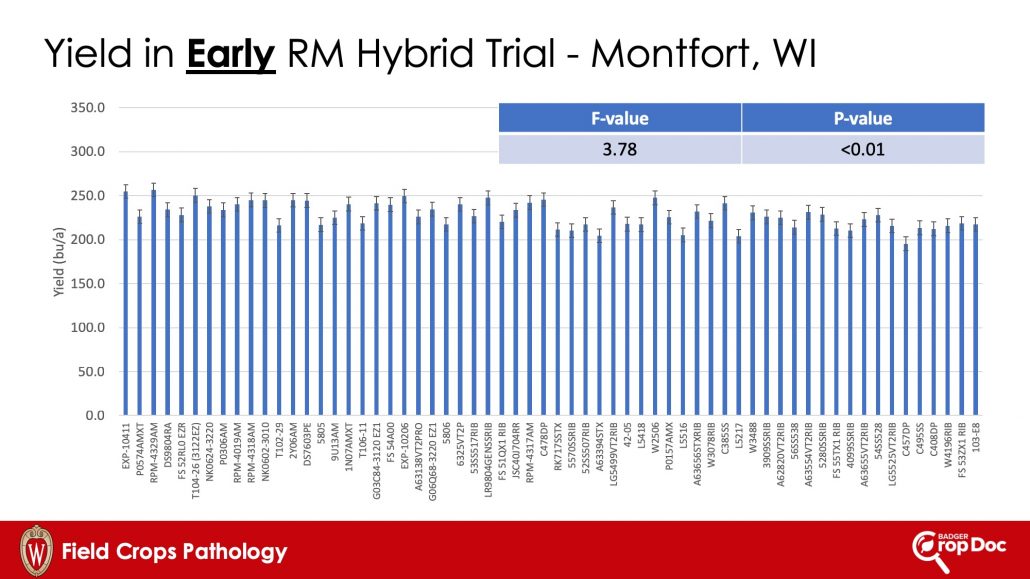
Figure 3. Yield from the early RM trial at Montfort, WI in 2018.
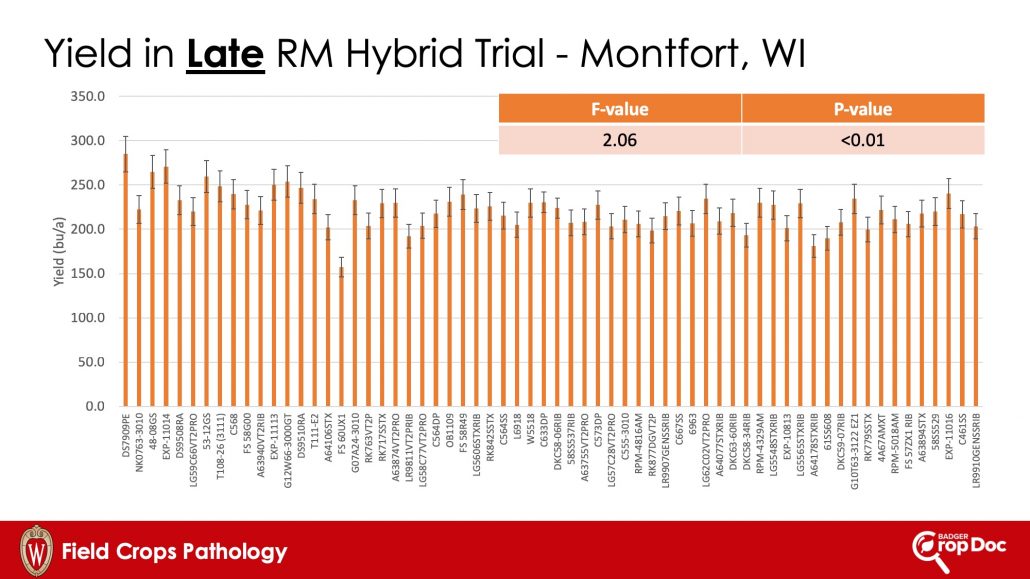
Figure 4. Yield from the late RM trial at Montfort, WI in 2018.
Our subsequent linear regression analysis (Figure 5) shows that there was clearly a trend toward lower yield as tar spot severity increased. For the early RM trial the fit of our line is better than for the late RM trial, however, the slope of the line indicates that there was a general reduction in yield as tar spot severity increased. For the early RM trial as tar spot severity increased by 10%, yield was reduced by about 7.8 bushels/acre, however, yield potential in this trial was almost 254 bushels/acre. In the late RM trial yield potential was 262 bushels/acre, but for every 10% increase in tar spot severity, yield was reduced by 13.5 bushels/acre.
Clearly there is some error in fitting our lines here and some “noise” in the data. This is most likely due to some differences in RM rating among companies and inherent genetic differences. However, there does seem to be a trend that as tar spot increases, grain yield in corn can be reduced. At this particular location, if we extrapolated our estimates out, at high ear leaf severity (45-50%), yield was reduced by 40-60 bushels/acre.
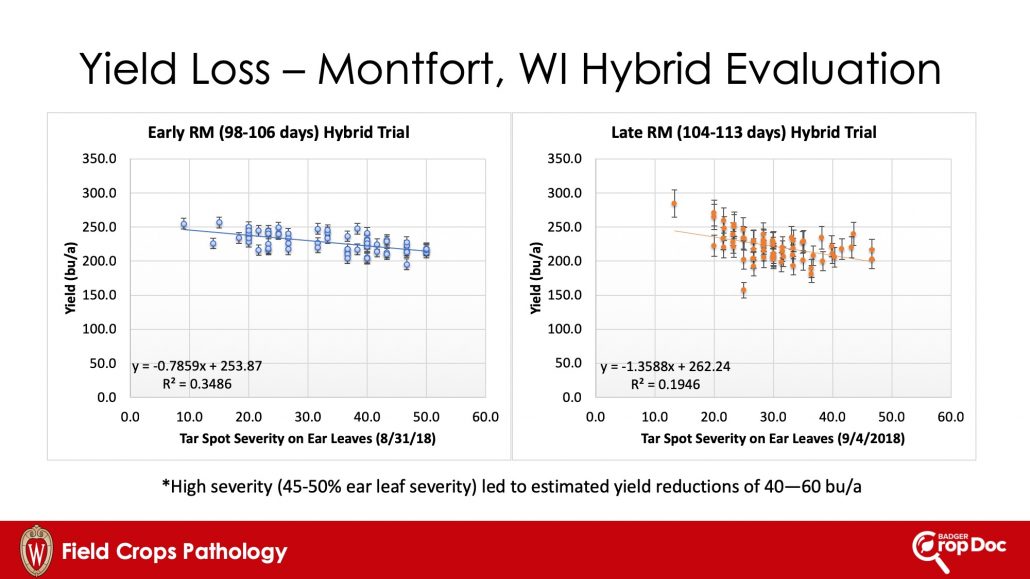
Figure 5. Yield relative to increasing tar spot severity for the early and late RM trials at Montfort, WI in 2018.
The Take Home
Some corn hybrids are more resistant than others to the tar spot pathogen. Resistance is not tied to a particular brand. That is to say, when it come to tar spot, every hybrid has to stand on its own. Strong resistance in corn hybrids in the trial above wasn’t common and immunity did not exist. As you make seed selections for 2019, push your seedsman to show you data from other trials for a particular hybrid where tar spot was a problem. Check other states data if you have to. For example, Dr. Martin Chilvers at Michigan State University conducted similar tar spot ratings on hybrids tested in Michigan. You can find the results of these hybrid evaluations by clicking here. Look for hybrids that gave a consistent response across multiple locations. Realize, even the best hybrid will still get some tar spot if the weather is favorable for the disease.
Fungicides might be warranted to further reduce tar spot once you have chosen a resistant hybrid. There are fungicides that do a decent job of reducing tar spot severity. The 2018 Wisconsin Field Crops Pathology Fungicide Tests Summary includes several trials where the efficacy of tar spot was evaluated. You can find those trials by clicking here. While there does seem to be some good choices in fungicide products, timing of application will be critical. It seems that fungicide applications that most closely coincided with the onset of the tar spot epidemics in a particular location, gave the best results. Thus, the performance of a fungicide will only be as good as the application timing relative to the start of the epidemic. To assist in making recommendations to spray, we are working on a tar spot prediction tool. Look for details of this tool next summer and be sure to follow Wisconsin Crop Manager News and Badercropdoc.com to get the latest updates and recommendations.