Mid-Season Corn and Soybean Disease Update and New Corn Fungicide ROI Calculator
Damon Smith, Extension Field Crops Pathologist, Department of Plant Pathology, University of Wisconsin-Madison
Tar Spot and Corn
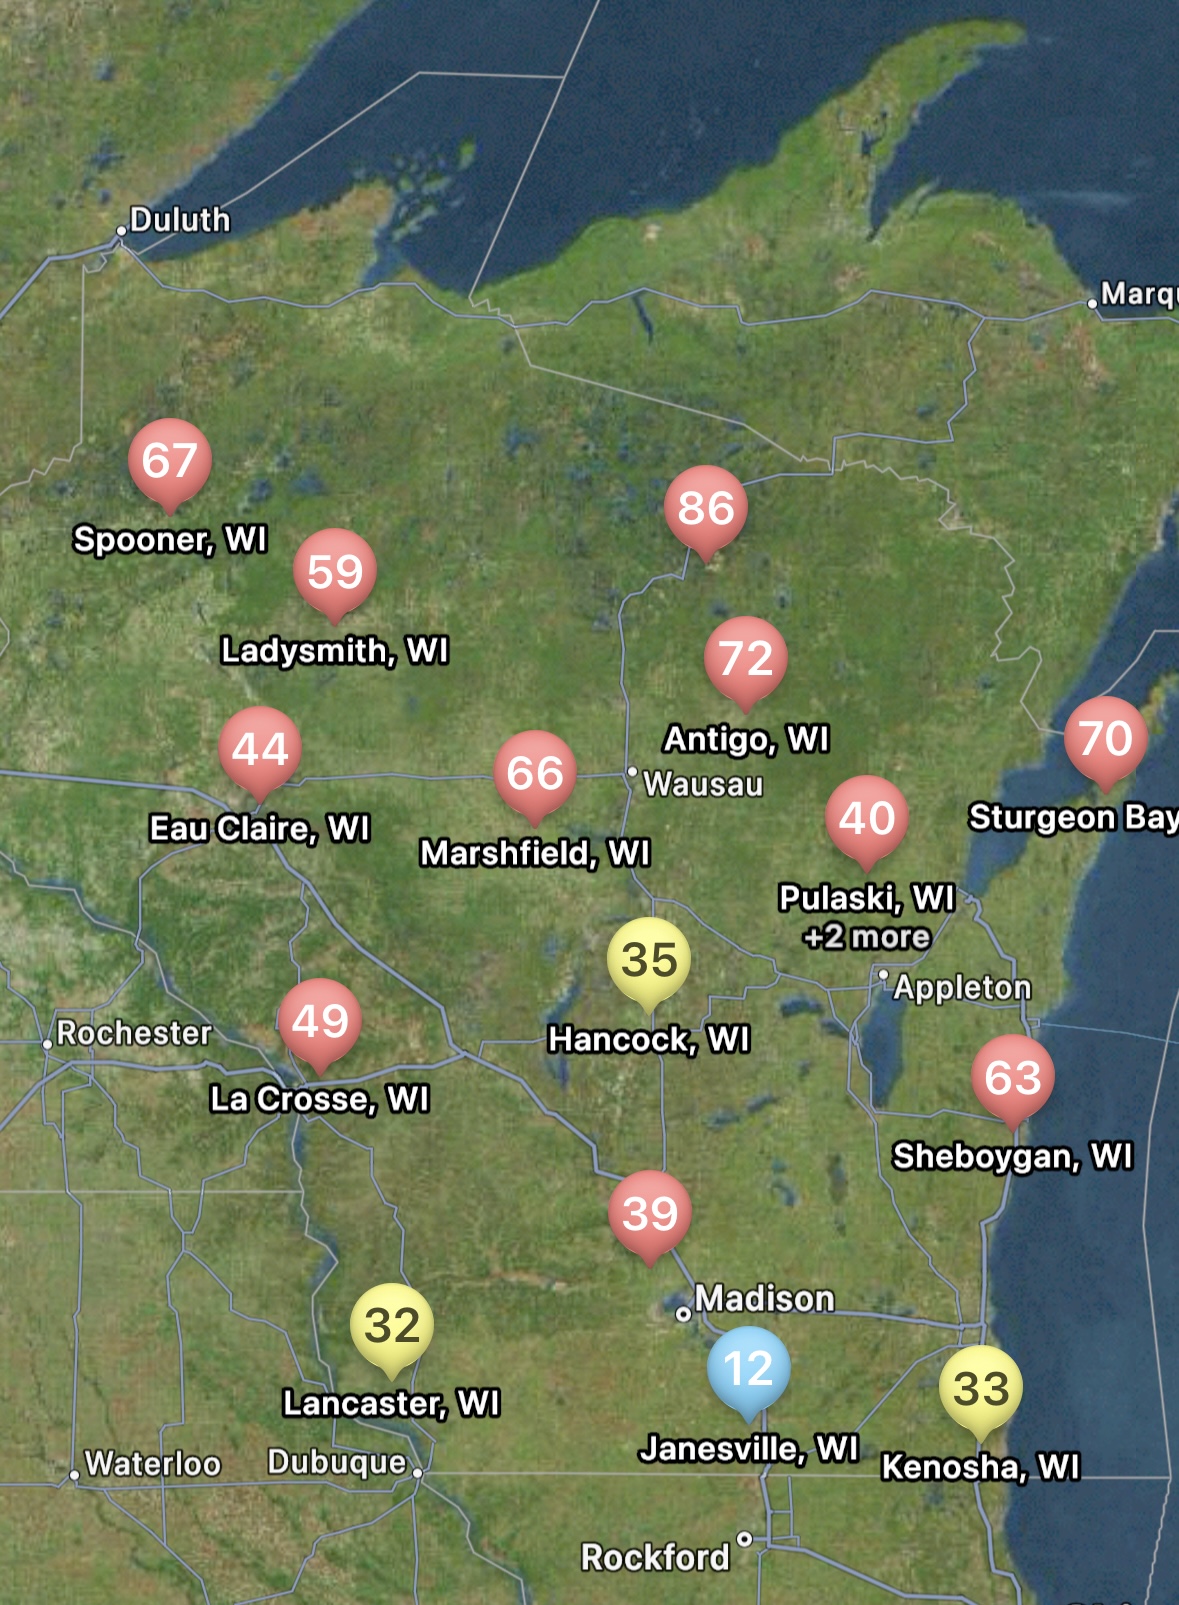
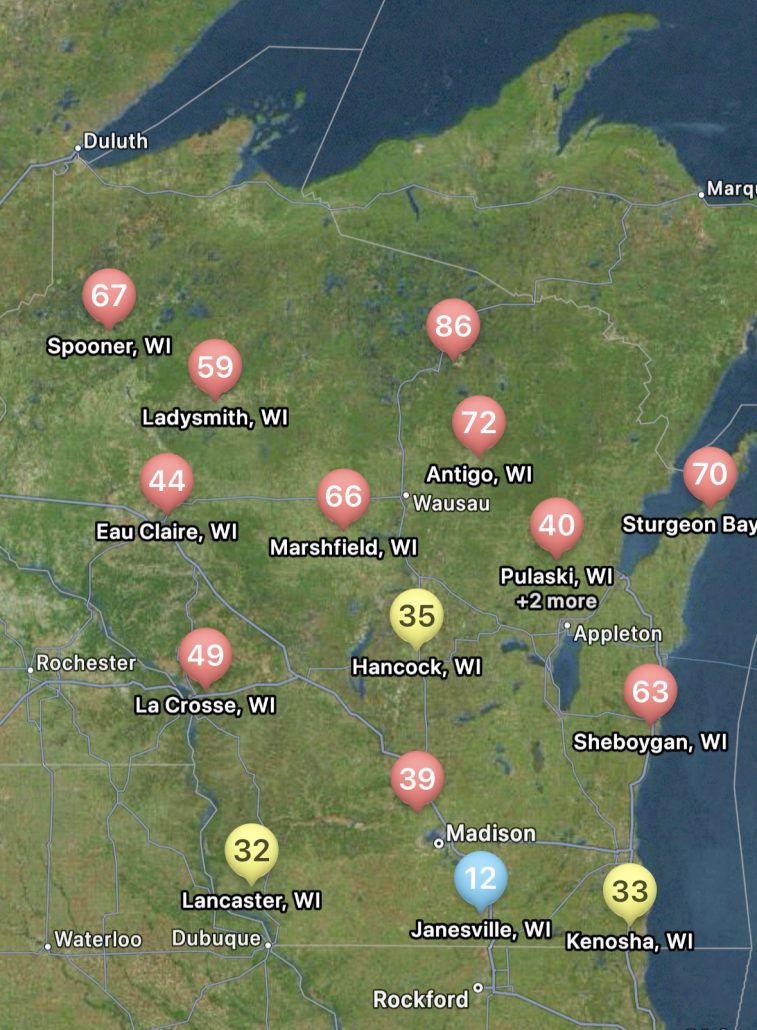
Figure 1. Statewide tar spot risk as calculated by the Field Prophet tool for July 22, 2024.
You can find the most recent updates on tar spot confirmations across the U.S. here: https://corn.ipmpipe.org/tarspot/. The Field Prophet tool is also showing mostly moderate to high risk across the state of Wisconsin (Fig. 1). This means that if your crop is between VT/R1 and R3 you should be actively scouting for tar spot and making the decision to apply a fungicide at this time. Our research has shown that one well-timed application of fungicide somewhere between VT/R1 – R3 will control tar spot enough for a yield response even in a heavy-pressure year. You can learn more about managing tar spot BY CLICKING HERE. If you think you found tar spot I would appreciate if you would let us know. We can enter the county level data into the Corn IPMPipe Map and contribute to the cause.
Gray Leaf Spot and Corn
We are also watching the gray leaf spot (GLS) situation closely. The southern and southwestern portions of the state have had enough heat and moisture that risk is likely high for this disease in those locations. For the rest of the state, risk isn’t as high, but likely moderate risk exists. Fortunately, the same fungicides that work well in controlling tar spot, also work well against GLS. Thus, another reason that a fungicide application may need to be considered at this point in the season.
Corn Fungicide ROI Calculator
With the tight margins in the corn market, and a high risk for disease due to wet weather, I have been getting a lot of questions about fungicide return on investment (ROI) this season. Fortunately, the scientists involved in the Crop Protection Network have been working on amassing fungicide performance and ROI data over the last few seasons and have launched a new interactive Fungicide ROI tool. The tool is research-based using data from across the entire U.S. corn production belt, including Wisconsin. During the studies included in this dataset, the diseases of interest were tar spot and also southern rust. Both are again diseases of interest this season. The tool can be used to run various scenarios that fit your farm and situation in the 2024 growing season. You can change the expected end-of-season disease severity levels, and the pricing of products included in the tool. Not all products labeled for corn can be found there, but most of the popular ones are included. You can also adjust the sale price for your crop, and expected farm yield, so that you can get real estimates of ROI and probability of breaking even for your situation. An example scenario can be found in figure 2 where I adjusted the tool to 180 bu/a yield and a corn sale price of $4 per bushel with expected high levels of tar spot or southern rust. You can see that several products result in a positive net benefit per acre using default product pricing. However, the tight margins this year, do result in lower breakeven probabilities. I would suggest running the tool for your situation. Be honest with yourself and put real numbers in the tool. This tool may be helpful for you if you are on the fence about spraying a fungicide this year. If you have a known resistant hybrid, your crop is already through to R3, and no disease has shown up yet, you might be able to help your financial situation by not spraying this season.

White Mold and Soybeans
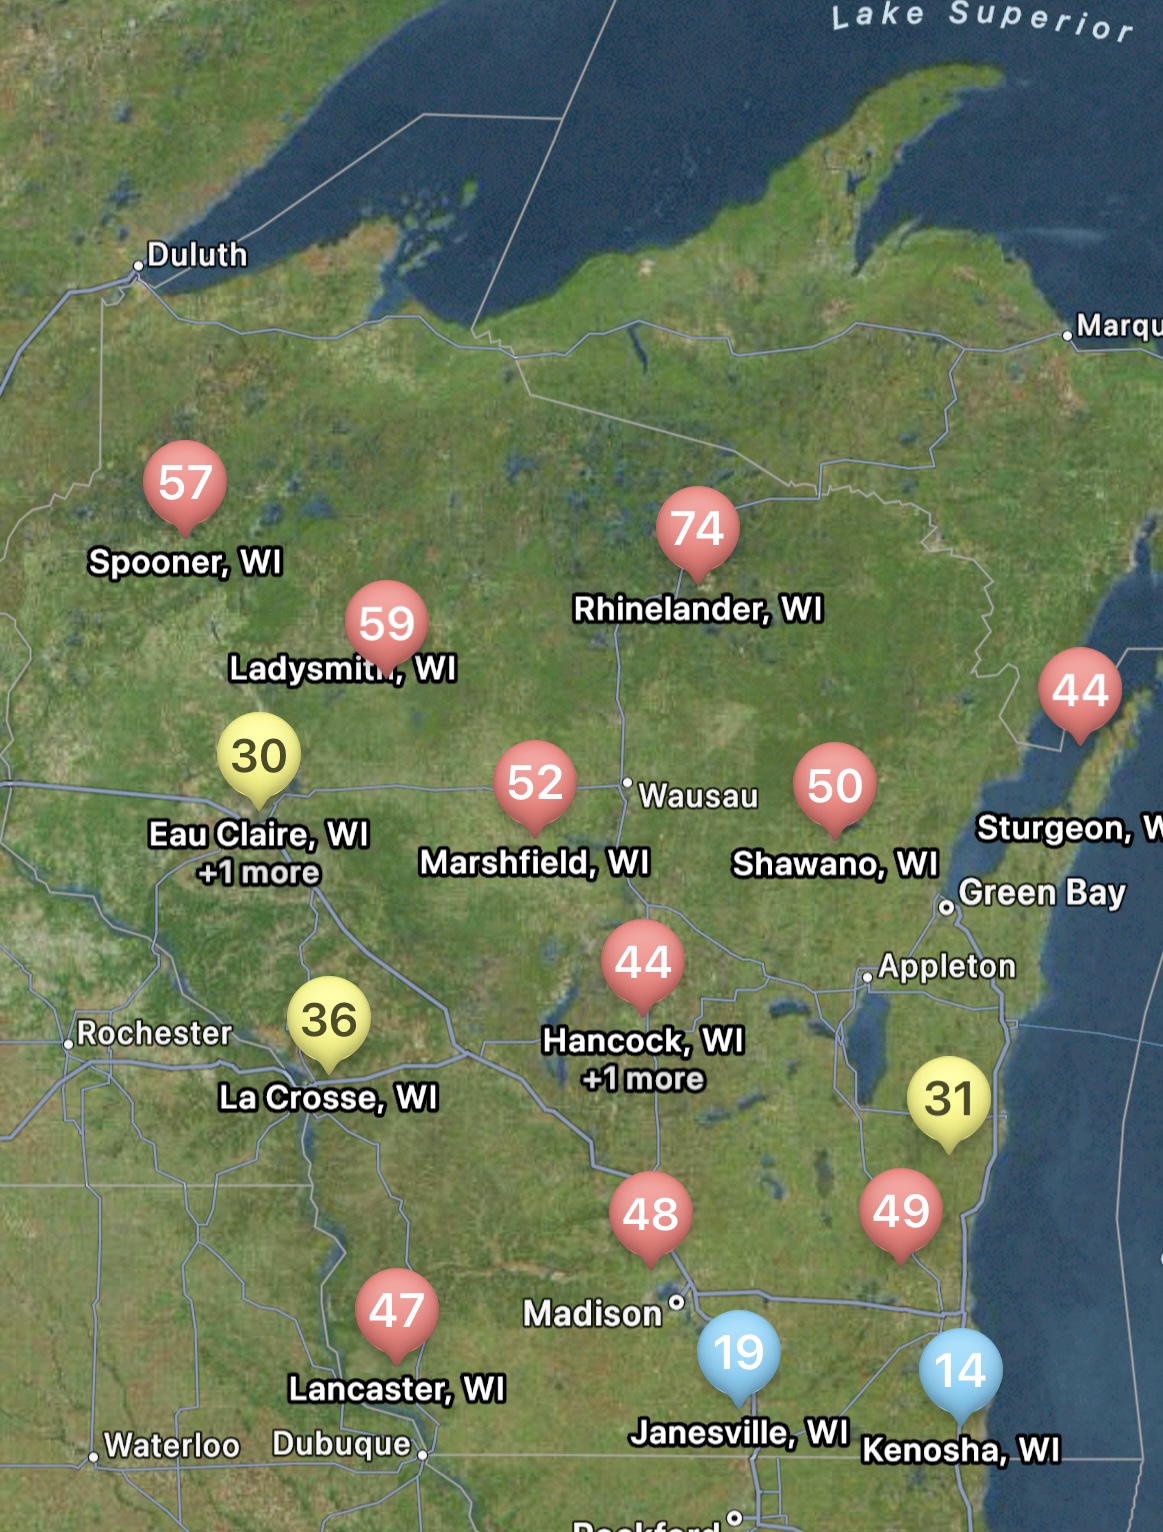
Figure 3. Statewide white mold risk as calculated by the Field Prophet tool for July 22, 2024.
The risk for white mold according to Field Prophet is a bit spottier compared to tar spot. Mostly the northern and central portions of the state are at high risk with some pockets of moderate risk. The southeastern portion of Wisconsin is at low risk currently (Fig. 3). This is due to hotter temperatures several weeks back. Regardless of location, our models are telling us that the risk for white mold will continue to rise across the state over the next 7 to 10 days. If you are in a low-risk area and you are at R3 or beyond, you might not have much to worry about for this year when it comes to white mold. However, if you are in a moderate-risk zone, watch this situation carefully. If you are at R3 and the crop has good canopy, you might consider one late R3 application. If you are in a high-risk zone, the crop has canopied, and your soybean crop is in the bloom period, it is time to think about a fungicide application. These will be the areas I would expect to find white mold 1-3 weeks from now. If you would like to learn more about white mold management, check out my previous article HERE.
As always, get out and look at the crop. Scout, scout, scout!