Wisconsin White Mold Risk Map – July 1, 2016

Damon L. Smith, Extension Field Crops Pathologist, University of Wisconsin-Madison

Jaime Willbur, Graduate Research Assistant, University of Wisconsin-Madison

Sclero-cast: A Soybean White Mold Prediction Model

**This tool is for guidance only and should be used with other sources of information and professional advice when determining risk of white mold development. We encourage you to read the model how-to guide which can be downloaded by clicking here**

White Mold Risk - July 1, 2016

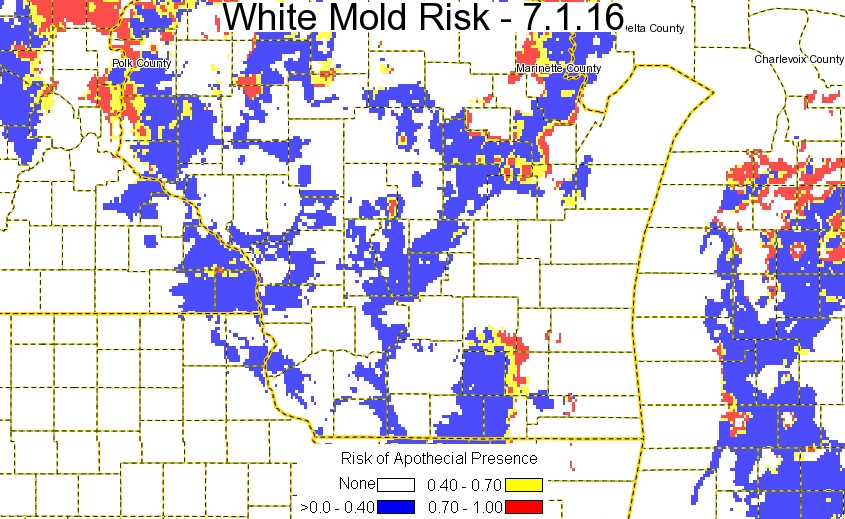
White Mold Risk – July 1, 2016

Risk of apothecial presence and subsequent white mold development is generally low for most of Wisconsin today. A few isolated pockets of moderate or higher risk are located around Shawano Co. and north of Barron Co. Soybeans in this area are likely not at the susceptible growth stage. A high-risk pocket is also present in the southeast in western Waukesha Co. Growers near this pocket should monitor the soybean crop for closing canopy and flowering growth stages that may lead to increased risk of white mold. Be sure to consult the how-to guide for assistance in interpreting this map.


This model was developed at the University of Wisconsin-Madison in conjunction with Michigan State University to identify at-risk regions which have been experiencing weather favorable for the development of white mold apothecia. This model predicts when apothecia will be present in the field using 30-day averages of maximum temperature, relative humidity, and wind speed. Using virtually available weather data, predictions can be made in most soybean growing regions. Based on these predictions, this map is generated and indicates areas at no (white), low (blue), medium (yellow), and high (red) risk levels. Fields in yellow or red areas have >40% chance of having apothecia present and may be at risk of white mold developing later in the season. Model predictions must be combined with soybean growth stage and canopy characteristics to aid in timing of fungicide sprays. If the model is predicting medium to high risk in your area, soybeans are flowering, and the canopy is somewhat closed, then the white mold risk is elevated. For further information on how to use and interpret this risk map, CLICK HERE to download a how-to guide.