How Will Delayed Planting Influence Crop Diseases in 2019?

Damon Smith, Extension Field Crops Pathologist, University of Wisconsin-Madison

Darcy Telenko, Extension Field Crops Pathologist, Purdue University

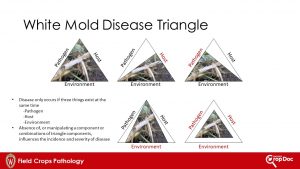
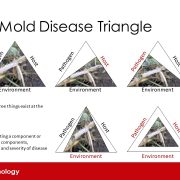
Figure 1. The Disease Triangle Concept

We keep getting this question, because as we write this, it is storming yet again in many locations in the Midwest. Rain, rain, and more rain has pushed back timely planting everywhere. Concern is starting to mount about not only yield loss simply from delayed planting, but what increased risk of yield loss due to disease there might be in 2019. As we consider this issue, we will use tar spot of corn and white mold of soybean as just two examples of where this could be an issue.

The Plant Disease Triangle. Remember that the plant disease triangle is the foundation for understanding how plant diseases develop and how to manage them. In order for a plant disease to occur you must have a virulent pathogen, a susceptible host plant, and favorable weather conditions to coincide at the same time. If any one of these three components is missing (or we implement a management strategy that removes or reduces one component) then a plant disease will not occur. When it comes to the host component, it not only matters that the host is generally susceptible but is also at a susceptible growth stage. Consider white mold of soybeans for a minute. All stages of soybean are susceptible to infection by the white mold fungus, but most infections occur through open flowers. Thus, the disease triangle is met when you have (1)white mold fungal spores flying around at the same time that (2)soybean flowers are open (susceptible stage), during, (3) cool and wet weather (favorable environmental condition)completing the triangle (Figure 1). The point here is that if we continue in a cool wet pattern, and delayed planting continues, we may quickly find ourselves with crops at susceptible growth stages when the weather is very conducive to disease.

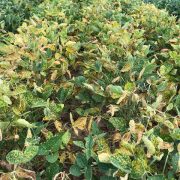
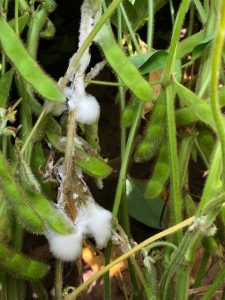
Figure 2. White Mold in a Soybean Field

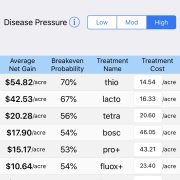
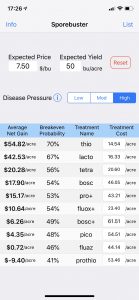
Delayed Planting and White Mold of Soybean. In 2017, we had an epic epidemic of white mold on soybean across the upper Midwest (Figure 2). One of the main reasons that the epidemic was so bad is that it was generally cool for a large portion of the season. This resulted in soybeans that moved very slowly from one growth stage to the next. When it came to flowering, soybeans bloomed for an extended period of time. This left them in a susceptible growth stage for about twice as long as normal. These cool conditions also coincided with wet weather that was favorable for the pathogen. In 2018, planting occurred reasonably on-time and we accumulated heat units quickly. Bloom started early in the season and was about half as long as it was in 2017. This meant that soybeans “escaped” infection in large portions of the upper Midwest. Fast-forward to 2019. If this cool rainy cycle persists, and planting is delayed, then soybeans may bloom later and over an extended period of time during wet/humid weather conditions. Keeping an eye on weather before and during the soybean bloom period along with consulting the Sporecaster smartphone app  can help you make the educated decision to spray fungicide or not.

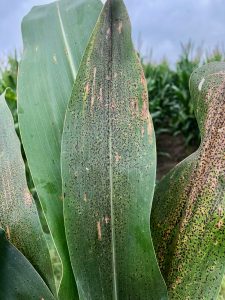
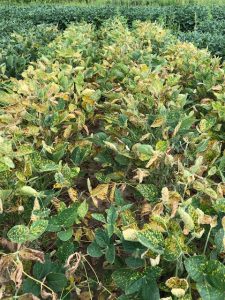
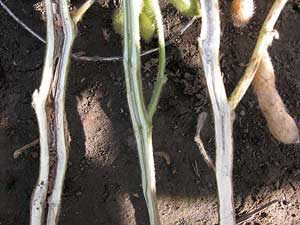
Figure 3. Tar Spot Signs and Symptoms on Corn Leaves

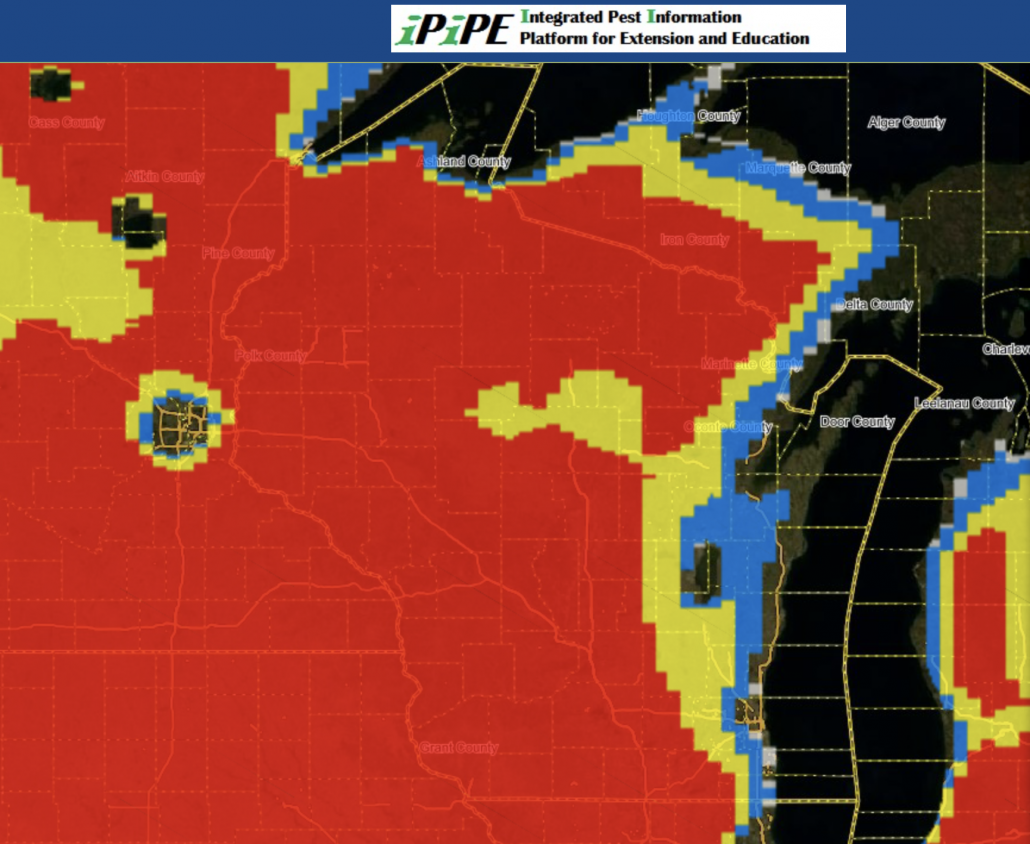
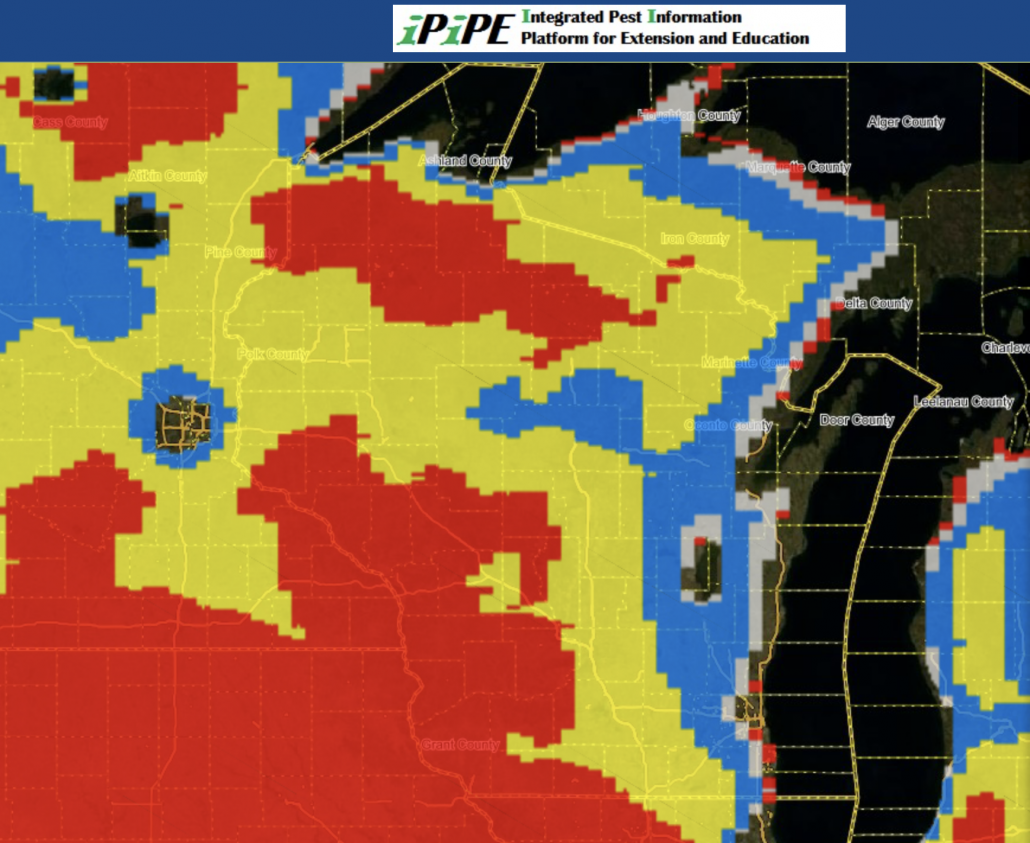
Delayed Planting and Tar Spot of Corn. In 2018 Tar spot of corn (Figure 3) created quite a stir. The epidemic was widespread and caused some significant yield losses in areas that it occurred. The tar spot fungus is residue-borne. There is also decent evidence that it can survive over-winter on corn residue (Figure 4). Our laboratories have been investigating tar spot fungal survival on corn residue collected after snow-melt in Wisconsin and Indiana. Regardless of whether there was fall tillage performed or not, survival of tar spot fungal spores (ascospores) on the residue collected ranged between 15 and 40%, with an average around 20%. These are VERY preliminary findings (and the numbers might change once we finish counting and analyzing data), but the point is that there is viable tar spot fungal inoculum present in Midwest corn fields. Therefore, one component of the triangle is met! As for the other two components, corn is being planted later than normal and conditions are cool and wet. Again, if this cycle of cool and wet holds, conditions will be favorable for the fungus. Delayed planting of corn will also push corn into conducive growth stages for the fungus to infect and cause heavy yield losses (although, we have seen infection at all growth stages as long as there was green tissue available). One of the reasons that the 2018 tar spot epidemic was so significant, was that many areas of the upper Midwest had cool and excessively wet conditions around the V6 growth stage and again near or after the VT growth stages. When foliar diseases of corn start at early growth stages (V6 or V8) the risk for yield loss can be much higher than if they start after R2 or brown silk. Keep an eye on the weather between the V6 and R2 growth stages and consult with your local extension personnel to decide if a fungicide might be warranted for corn to prevent tar spot, or other foliar diseases.

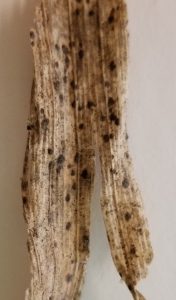
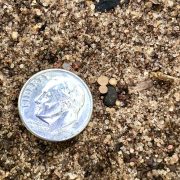
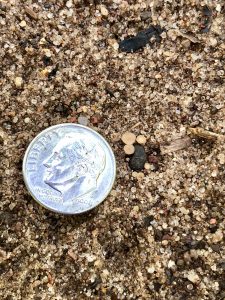
Figure 4. Signs of the Tar Spot Fungus on Corn Residue

Scouting and Watching Weather Reports Might Pay in 2019. Once corn and soybeans are planted, take the time to scout and pay attention to the weather. While thorough scouting can take time, it may be worth it in 2019. Catching a plant disease early can be the difference in being successful in managing it or not. Pay attention to the weather leading up to, and during, the critical crop growth stages. This can also help you make an educated decision about in-season application of fungicides. If it is cool and humid/rainy, and the crop is at a susceptible growth stage, then a fungicide application might be warranted. If it is hot and dry and the crop moves quickly through susceptible growth stages, then a fungicide might not be warranted. Study the disease triangle and use it to your advantage. The 2019 field season could be a year that this knowledge might be handy!

For in-season updates follow us on Twitter and Consult our websites at the links below:

Dr. Damon Smith

@badgercropdoc

https://badgercropdoc.com/


Dr. Darcy Telenko

@DTelenko

https://extension.purdue.edu/fieldcroppathology/


For More information about tar spot, white mold, and fungicide efficacy consult the following resources:

  1. Tar spot Fact sheet
  2. Short Tar Spot Video
  3. Tar Spot Webinar 
  4. White Mold Fact Sheet
  5. Short White Mold Video
  6. White Mold Webinar
  7. Corn Fungicide Efficacy Table
  8. Soybean Fungicide Efficacy Table

Sporebuster, a New White Mold Fungicide Value Calculator

Damon L. Smith, Ph.D., Associate Professor and Extension Specialist, Department of Plant Pathology, University of Wisconsin-Madison

When a fungicide application is needed to control white mold in soybeans, Sporebuster can help determine a profitable program. You enter your expected soybean price, expected yield, and treatment cost. Sporebuster instantly compares ten different treatment plans at once to determine average net gain and breakeven probability of each. You can mark, save and share by email, the best plans for your farming operation.

The purpose of Sporebuster is to assist soybean farmers in making a fungicide program decision that is profitable for their operation. Sporebuster is meant to complement Sporecaster, which is a tool that can be used to make the decision whether a fungicide application is even needed. Once Sporecaster recommends a fungicide application, Sporebuster can be used to determine a profitable program. To learn more about Sporebuster, how to use it, and to download it, click here.

Wisconsin Late-Season Soybean Disease Update

Damon L. Smith, Extension Field Crops Pathologist, University of Wisconsin-Madison

The calls have been coming in this past week on a couple of soybean diseases. In the southern third of the state most of the calls have centered on sudden death syndrome or SDS. To the north, most questions pertain to Sclerotinia stem rot or white mold. I’ll discuss SDS in some detail, plus provide a detailed description of brown stem rot (BSR) which also typically shows up this time of year. Finally I’ll provide a brief update on the white mold situation.

Sudden death syndrome (SDS)

Symptoms of sudden death syndrome on soybeans

The first noticeable symptoms of SDS are chlorotic (i.e., yellow) blotches that form between the veins of soybean leaflets. These blotches expand into large, irregular, chlorotic patches (also between the veins), and this chlorotic tissue later dies and turns brown. Soon thereafter entire leaflets will die and shrivel. In severe cases, leaflets will drop off leaving the petioles attached. Taproots and below-ground portions of the stems of plants suffering from SDS, when split open, will exhibit a slightly tan to light brown discoloration of the vascular (i.e., water- conducting) tissue. The pith will remain white or cream-colored. In plants with advanced foliar symptoms of SDS, small, light blue patches will form on taproots and stems below the soil line. These patches are spore masses of the fungus that causes the disease.

Foliar symptoms of SDS can be confused with those of brown stem rot. However, in the case of brown stem rot (BSR), the pith of affected soybean plants will be brown. In addition, roots and lower stems of plants suffering from BSR will not have light blue spore masses.

Once symptoms of SDS are evident, yield losses are inevitable. Yield losses can range from slight to 100%, depending on the soybean variety being grown, the plant growth stage at the time of infection and whether or not SCN is present in a field. If SDS occurs after reproductive stages R5 or R6, impact on yield is usually less compared to the development of SDS at flowering that can lead to substantial yield losses. When SCN is present, the combined damage from both diseases can be substantially more than the sum of the damage expected from the individual diseases.

SDS is caused by the soilborne fungus, Fusarium virguliforme (synonym: F. solani f. sp. glycines). F. virguliforme can overwinter freely in the soil, in crop residue, and in the cysts of SCN. The fungus infects soybean roots (by some reports as early as one week after crop emergence), and is generally restricted to roots as well as stems near the soil line. F. virguliforme does not invade leaves, flowers, pods or seeds, but does produce toxins in the roots that move to the leaves, causing SDS’s characteristic foliar symptoms.

SDS cannot be controlled once plants have been infected. Foliar fungicides have NO effect on the disease.Recently a new seed treatment has been identified that has efficacy against SDS. The active ingredient fluopyram can be found in the seed treatment iLeVo and is rated “very good” in multi-state trials. Other methods of control include using SDS-resistant varieties whenever possible in fields with a history of the disease; however, keep in mind that SDS-resistant varieties with maturity groups suitable for Wisconsin and other northern regions (groups I and II) can be limited. If SDS and SCN are both problems in the same field, planting an SCN-resistant soybean variety may also be beneficial in managing SDS. Do not delay planting soybeans to avoid symptoms of SDS.  In Wisconsin, it has been demonstrated that the benefits to yield when planting early outweigh the benefits of reduced SDS symptoms if planting is delayed. Improve soil drainage by using tillage practices that reduce compaction problems. Rotation, while useful in managing other soybean diseases, does not appear to significantly reduce the severity of SDS. Even after several years of continuous production of corn, F. virguliforme populations typically are not reduced substantially. Research from Iowa State University has shown that corn (especially corn kernels) can harbor the SDS pathogen.

For more information CLICK HERE to download a full color fact sheet on SDS. A short video on SDS can also be viewed by CLICKING HERE.

Brown stem rot (BSR)

Symptoms of BSR in soybean stems compared with a healthy soybean stem in the center.

Symptoms of BSR are usually not evident until late in the growing season and may be confused with signs of crop maturity or the effect of dry soils. The most characteristic symptom of BSR is the brown discoloration of the pith especially at and between nodes near the soil line. This symptom is best scouted for at full pod stage. Foliar symptoms, although not always present, typically occur after air temperatures have been at to below normal during growth stages R3-R4, and often first appear at stage R5, peaking at stage R7. Foliar symptoms include interveinal chlorosis and necrosis (i.e., yellowing and browning of tissue between leaf veins), followed by leaf wilting and curling. Yield loss as a result of BSR is generally greatest when foliar symptoms develop. The severity of BSR symptoms increases when soil moisture is near field capacity (i.e., when conditions are optimal for crop development).

Foliar symptoms of BSR can be confused with those of sudden death syndrome (see description below). However, in the case of sudden death syndrome (SDS), the pith of affected soybean plants will remain white or cream-colored. In addition, roots and lower stems of plants suffering from SDS (but not those suffering from BSR) often have light blue patches indicative of spore masses of the fungus that causes SDS.

BSR is caused by the soilborne fungus Cadophora gregata. There are two distinct types (or genotypes) of the fungus, denoted Type A and Type B. Type A is the more aggressive strain and causes more internal damage and plant defoliation than Type B. P. gregata Type A also is associated with higher yield loss. P. gregata survives in soybean residue, with survival time directly related to the length of time that it takes for soybean residue to decay. Thus, P. gregata survives longer when soybean residue is left on the soil surface (e.g., in no till settings) where the rate of residue decay is slow. P. gregata infects soybean roots early in the growing season. It then moves up into the stems, invading the vascular system (i.e., the water-conducting tissue) and interfering with the movement of water and nutrients.

Several factors can influence BSR severity. Research from the University of Wisconsin has shown that the incidence and severity of BSR is greatest in soils with low levels of phosphorus and potassium, and a soil pH below 6.3. In addition, C. gregata and soybean cyst nematode (Heterodera glycines) frequently occur in fields together, and there is evidence that BSR is more severe in the presence of this nematode.

BSR cannot be controlled once plants have been infected. Foliar fungicides and fungicide seed treatments have NO effect on the disease. Use crop rotations of two to three years away from soybean with a non-host crop (e.g., small grains, corn, or vegetable crops), as well as tillage methods that incorporate plant residue into the soil. Both of these techniques will help reduce pathogen populations by promoting decomposition of soybean residue. Also, make sure that soil fertility and pH are optimized for soybean production to avoid overly low phosphorus and potassium levels, as well as overly low soil pH. Finally, grow soybean varieties with resistance to BSR. Complete resistance to BSR is not available in commercial varieties. However several sources of partial resistance that provide moderate to excellent BSR control are available. Also, some, but not all, varieties of soybean cyst nematode (SCN) resistant soybeans also are resistant to BSR. Most soybean varieties with SCN resistance derived from PI 88788 express resistance to BSR. However, the same is not true of varieties with SCN resistance derived from Peking. Therefore growers should consult seed company representatives about BSR resistance when selecting a variety with SCN resistance derived from this source. You can download a full color fact sheet on BSR by clicking here. You can also CLICK HERE to view a short video on BSR.

White Mold

White, fluffy growth of the white mold fungus on a soybean stem

Symptoms of white mold are becoming pretty apparent in Wisconsin. White fluffy growth (mycelium) is readily evident. Incidence in the northern half of the state is higher. We have visited fields as far north as Wausau and Pulaski, Wisconsin and have observed incidence ranging from 0% to 30% of plants infected. Reports from areas in the northwest indicate white mold present, but not as high of incidence levels. As we move to the southern portion of Wisconsin, white mold can be found, but at reasonably low levels. Most of the soybean crop is at the R5 growth stage, with some earlier maturing fields approaching R6. Questions have arisen about spraying fungicide now to reduce the damage caused by white mold and preserve yield. The short answer is NO. The reason is that the primary means of infection by the white mold fungus is through soybean flowers. These infections happened weeks ago. Therefore, the optimal time to spray would be when flowers were out. A low level of plant-to-plant transmission can occur late in the season in soybeans. However, this rate is low enough, that spraying to prevent it does not produce favorable results.

How much soybean yield might I lose from white mold?

Research has demonstrated that for every 10% increase in the number of plants that are infected with white mold at the R7 growth stage, you can expect between 2 to 5 bushels of yield loss. Thus, the fields I mentioned earlier will likely range from little detectable yield loss (3% incidence) to as high as 10 bushels lost (20% incidence).

What should I do if I see white mold in my soybean field now?

Get out and survey your fields for white mold. It is a good idea to determine how much white mold you have in your fields, so you can make some educated harvest decisions. One way to move white mold from one field to the next is via combines. You could clean your combine between each field, but this can be time consuming. So by determining which fields have no white mold and which fields have the most white mold, you can develop a logical harvest order by beginning your harvest on fields with no white mold and working your way to the heavily infested fields. This will help reduce spread of the white mold fungus to fields that aren’t infested. You can also make some decisions on your rotation plan and future soybean variety choices based on these late season observations.

If you would like to learn more about white mold and management of this disease, CLICK HERE to download a fact sheet from the crop protection network. You can also watch a short video about white mold by CLICKING HERE.

Wisconsin White Mold Risk Maps – July 29, 2018

Damon L. Smith, Extension Field Crops Pathologist, University of Wisconsin-Madison

**These maps are for guidance only and should be used with other sources of information and professional advice when determining risk of white mold development. For field-specific predictions, we encourage you to use the Sporecaster smartphone application. These predictions will be most accurate for your specific location. Information about Sporecaster and how to download can be found by clicking here. Sporecaster takes into account crop phenology, in addition to weather parameters, to make field-specific recommendations. The maps below are based on weather only and you must determine if your crop is currently phenologically at risk for infection. For more information on white mold and how to manage it, see my previous post.**


Map Legends: No color = model is inactive and risk of apothecia in the field is not likely; Gray = apothecia might be present, but likelihood of apothecial presence is extremely low; Blue = low risk of apothecia; Yellow = medium risk of apothecia in the field; Red = high risk of apothecia in the field. Model predictions must be combined with soybean growth stage and canopy characteristics to aid in timing of fungicide sprays.


Figure 1. White Mold Risk Map for Non-irrigated Fields – July 29, 2018

Cooler, dry weather has changed the white mold risk map over the last several weeks for non-irrigated (dryland or rain-fed) soybean fields (Figure 1). Cool weather has generated some areas of high risk in the southwest, western, and north-central regions of the state. However, the dry conditions have dissipated much of the moderate and low risk areas that showed several weeks ago. Risk in general is much more spotty than it has been. The soybean crop is also moving through growth stages much more rapidly than in 2017. Thus, the risk window for infection by the white mold fungus will end soon. Remember that once the crop has finished flowering risk of new infections is low to non-existent. In addition, late applications (R4 and later growth stages) of fungicide will not be needed for white mold control.


Figure 2. White Mold Risk Map for irrigated fields planted on 15″ row-spacing – July 29, 2018

Risk remains high across much of the state for irrigated soybeans planted to 15″ rows (Figure 2). Risk is starting to dissipate in areas in the east-central region, due to dryer conditions. However, a fungicide application should be considered if irrigating and soybeans are flowering and planted to a 15″ row-spacing. Note that if you have irrigation in your field but are not actually irrigating, you should be using the non-irrigated model above to make an accurate prediction of white mold risk.


Figure 3. White Mold Risk Map for irrigated fields planted on 30″ row-spacing – July 29, 2018

Risk of white mold in irrigated fields planted to 30″ row-spacing has decreased a bit in some areas, since the last post (Figure 3). However, Much of the state is at risk if irrigating on 30″ spaced soybeans. In these areas, a fungicide application should be considered if soybeans are being irrigated, canopy is nearly closed, and flowers are present. Note that if you have irrigation in your field but are not actually irrigating, you should be using the non-irrigated model above to make an accurate prediction of white mold risk.


These models were developed at the University of Wisconsin-Madison in conjunction with Michigan State University and Iowa State University to identify at-risk regions which have been experiencing weather favorable for the development of white mold fungus apothecia. Weather information and maps are provided by the Soybean Integrated Pest Information Platform for Extension and Education (iPIPE), which is managed by ZedX, Inc. These models predict when apothecia will be present in the field using combinations of 30-day averages of maximum temperature, relative humidity, and maximum wind speed. Using virtually available weather data, predictions can be made in most soybean growing regions. Based on these predictions, a map is generated under three scenarios (non-irrigated soybeans, soybeans planted on 15″ row-spacing and irrigated, or soybeans planted on 30″ row-spacing and irrigated). The maps are colored to show the likelihood of apothecial presence within a region.  If the model is predicting high risk (red) in your area for your planting scenario, the soybeans are flowering, and the canopy is somewhat closed, then the white mold risk is high. If your fields are at-risk, we recommend to consult your local extension personnel or other research-based resources for the best in-season management options for your area.

Wisconsin White Mold Risk Maps – July 15, 2018

Damon L. Smith, Extension Field Crops Pathologist, University of Wisconsin-Madison

**These maps are for guidance only and should be used with other sources of information and professional advice when determining risk of white mold development. For field-specific predictions, we encourage you to use the Sporecaster smartphone application. These predictions will be most accurate for your specific location. Information about Sporecaster and how to download can be found by clicking here. Sporecaster takes into account crop phenology, in addition to weather parameters, to make field-specific recommendations. The maps below are based on weather only and you must determine if your crop is currently phenologically at risk for infection. For more information on white mold and how to manage it, see my previous post.**


Map Legends: No color = model is inactive and risk of apothecia in the field is not likely; Gray = apothecia might be present, but likelihood of apothecial presence is extremely low; Blue = low risk of apothecia; Yellow = medium risk of apothecia in the field; Red = high risk of apothecia in the field. Model predictions must be combined with soybean growth stage and canopy characteristics to aid in timing of fungicide sprays.


Figure 1. White Mold Risk Map for Non-irrigated Fields – July 15, 2018

Hot, dry weather continues to push risk for white mold down in non-irrigated (dryland or rain-fed) soybean fields (Figure 1). While risk is high in some locations of the state, there is much more yellow on the map compared to last week, indicating medium risk. Continued areas of high risk are present along Lake Michigan and in the central and southwest portions of Wisconsin. In these areas, a fungicide application should be considered if the soybean canopy is nearly closed and flowers are present.

Figure 2. White Mold Risk Map for irrigated fields planted on 15″ row-spacing – July 15, 2018

Risk remains high across the state for irrigated soybeans planted to 15″ rows (Figure 2). A fungicide application should be considered if irrigating and soybeans are flowering and planted to a 15″ row-spacing. Note that if you have irrigation in your field but are not actually irrigating, you should be using the non-irrigated model above to make an accurate prediction of white mold risk.

Figure 3. White Mold Risk Map for irrigated fields planted on 30″ row-spacing – July 15, 2018

Risk of white mold in irrigated fields planted to 30″ row-spacing has increased significantly since last week (Figure 3). Much of the state is at risk if irrigating on 30″ spaced soybeans. In these areas, a fungicide application should be considered if soybeans are being irrigated, canopy is nearly closed, and flowers are present.


These models were developed at the University of Wisconsin-Madison in conjunction with Michigan State University and Iowa State University to identify at-risk regions which have been experiencing weather favorable for the development of white mold fungus apothecia. Weather information and maps are provided by the Soybean Integrated Pest Information Platform for Extension and Education (iPIPE), which is managed by ZedX, Inc. This model predicts when apothecia will be present in the field using combinations of 30-day averages of maximum temperature, relative humidity, and maximum wind speed. Using virtually available weather data, predictions can be made in most soybean growing regions. Based on these predictions, a map is generated under three scenarios (non-irrigated soybeans, soybeans planted on 15″ row-spacing and irrigated, or soybeans planted on 30″ row-spacing and irrigated). The maps are colored to show the likelihood of apothecial presence within a region.  If the model is predicting high risk (red) in your area for your planting scenario, the soybeans are flowering, and the canopy is somewhat closed, then the white mold risk is high. If your fields are at-risk, we recommend to consult your local extension personnel or other research-based resources for the best in-season management options for your area

Wisconsin White Mold Risk Maps – July 8, 2018

Damon L. Smith, Extension Field Crops Pathologist, University of Wisconsin-Madison

**These maps are for guidance only and should be used with other sources of information and professional advice when determining risk of white mold development. For field-specific predictions, we encourage you to use the Sporecaster smartphone application. These predictions will be most accurate for your specific location. Information about Sporecaster and how to download can be found by clicking here. Sporecaster takes into account crop phenology, in addition to weather parameters, to make field-specific recommendations. The maps below are based on weather only and you must determine if your crop is currently phenologically at risk for infection. For more information on white mold and how to manage it, see my previous post.**


Map Legends: No color = model is inactive and risk of apothecia in the field is not likely; Gray = apothecia might be present, but likelihood of apothecial presence is extremely low; Blue = low risk of apothecia; Yellow = medium risk of apothecia in the field; Red = high risk of apothecia in the field. Model predictions must be combined with soybean growth stage and canopy characteristics to aid in timing of fungicide sprays.


Figure 1. White Mold Risk Map for Non-irrigated Fields – July 8, 2018

Continued dry and windy weather is beginning to reduce the predicted risk of white mold across Wisconsin in non-irrigated (dryland or rain-fed) soybean fields (Figure 1). While risk is high in some locations of the state, there is much more yellow and blue on the map compared to last week, indicating medium to low risk. Over the next week, I expect risk to continue to dissipate as weather is predicted to remain warm and dry. Areas of high risk are present along Lake Michigan and in the central and southwest portions of Wisconsin. In these areas, a fungicide application should be considered if the soybean canopy is nearly closed and flowers are present.

Figure 2. White Mold Risk Map for irrigated fields planted on 15″ row-spacing – July 8, 2018

As you might expect, risk is much higher across the state for irrigated soybeans planted to 15″ rows (Figure 2). Remember that there are different models for irrigated and non-irrigated soybeans. Thus predictions can vary across the state in these environments. A fungicide application should be considered if irrigating and soybeans are flowering and planted to a 15″ row-spacing. Note that if you have irrigation in your field but are not actually irrigating, you should be using the non-irrigated model above to make an accurate prediction of white mold risk.

Figure 3. White Mold Risk Map for irrigated fields planted on 30″ row-spacing – July 8, 2018

Risk of white mold in irrigated fields planted to 30″ row-spacing is much a bit less than in 15″ spacing (Figure 3). However, areas of high risk are present in the southwest and far northern areas of soybean production. In these areas, a fungicide application should be considered if soybeans are being irrigated, canopy is nearly closed, and flowers are present.


These models were developed at the University of Wisconsin-Madison in conjunction with Michigan State University and Iowa State University to identify at-risk regions which have been experiencing weather favorable for the development of white mold fungus apothecia. Weather information and maps are provided by the Soybean Integrated Pest Information Platform for Extension and Education (iPIPE), which is managed by ZedX, Inc. This model predicts when apothecia will be present in the field using combinations of 30-day averages of maximum temperature, relative humidity, and maximum wind speed. Using virtually available weather data, predictions can be made in most soybean growing regions. Based on these predictions, a map is generated under three scenarios (non-irrigated soybeans, soybeans planted on 15″ row-spacing and irrigated, or soybeans planted on 30″ row-spacing and irrigated). The maps are colored to show the likelihood of apothecial presence within a region.  If the model is predicting high risk (red) in your area for your planting scenario, the soybeans are flowering, and the canopy is somewhat closed, then the white mold risk is high. If your fields are at-risk, we recommend to consult your local extension personnel or other research-based resources for the best in-season management options for your area

It’s Time for Fireworks and Spores To Fly: Independence Week in Wisconsin Brings White Mold Management Decisions

Damon Smith, Extension Field Crops Pathologist, Department of Plant Pathology, University of Wisconsin-Madison

Shawn Conley, Extension Soybean and Small Grains Agronomist, Department of Agronomy, University of Wisconsin-Madison

Roger Schmidt, Nutrient and Pest Management Program, University of Wisconsin-Madison

Figure 1. Apothecia, small mushroom-like structures of the white mold fungus that give rise to spores, which infect soybean flowers. Note the small pale orange structures to the right of the dime.

The week of Independence day is here and we are all looking forward to fireworks, festivities, and time with friends and family. This first week of July also brings us a heightened awareness of white mold in soybeans and its management. In 2017 we had one of the most epic white mold epidemics on record. Many high-yielding soybean fields in the state were slammed with white mold, resulting in some serious yield losses in many fields around Wisconsin. I have been asked many times this season, “Are we in for white mold as bad as 2017?” The short answer is no, I don’t think so.

Weather in 2017 was incredibly cool for the majority of the time. This had two effects which were responsible for the extreme white mold epidemic in 2017. First, soybeans moved extremely slow through each growth stage. This meant that the flowering window went on for about twice as long as normal for many of the varieties of soybeans we grow here in Wisconsin. This extended flowering period resulted in an extended period of time that soybeans were susceptible to infection. Remember that the white mold fungus infects soybeans through open and senescing flower, by spores that are born from small mushroom-like structures called apothecia (Fig. 1). This extended bloom period meant that the window of opportunity for the fungus was also extended. Couple this with the fact that those same cool conditions were also optimal for the fungus to infect and grow. It was a double whammy in 2017.

In 2018, the season has already seen several instances of 2 or 3 day durations of high temperatures of 90F or above. This has done a couple of things. It has pushed the soybean crop very quickly this year. I estimate that the crop is about 2 weeks ahead of last season, in the southern and south-central region of Wisconsin. With continued stretches of warm weather in the forecast, I expect flowering duration to be closer to ‘normal’, or at least shorter than last season. This means the crop won’t be subjected to such a long period of susceptibility, compared to 2017. Furthermore, these stretches of high temperatures of 90F or above should make conditions somewhat less conducive for the fungus. With that said, we need to pay attention to weather as we have had plenty of rain and humidity, which can be favorable for white mold. So will we have white mold in Wisconsin in 2018? Yes. Will it be has significant as 2017, I hope not.

Figure 2. White mold predictions for rain-fed (non-irrigated) fields for June 30, 2018. Blue indicates low risk, yellow medium risk, and red indicates high risk of infection for flowering soybeans.

Predicting White Mold

The flowering growth stages are a critical time to manage white mold in-season. You can view a fact sheet and video on the subject. As you probably know, timing in-season fungicide sprays at the correct time during the soybean bloom period can be extremely difficult. To help solve this decision-making issue, models were developed at the University of Wisconsin-Madison in conjunction with Michigan State University and Iowa State University to identify at-risk regions which have been experiencing weather favorable for the development of white mold apothecia. These models predict when apothecia will be present in the field using combinations of 30-day averages of maximum temperature, relative humidity, and wind speed. Using virtually available weather data, predictions can be made in most soybean growing regions. In past years we have overlaid model outputs onto maps to achieve a landscape view of the current risk. An example of a current map for this season is in figure 2. You can see we have some areas of favorable weather for white mold risk. However, more precise predictions would help determine the site-specific risk. To facilitate more precise predictions, we have launched the Sporecaster smartphone application for Android and iPhone for the 2018 season.

The purpose of the app is to assist farmers in making early season management decisions for white mold in soybean. The best time to spray fungicides for white mold is during flowering (R1 and R3 growth stages) when apothecia are present on the soil surface.

Sporecaster uses university research to turn a few simple taps on a smartphone screen into an instant forecast of the risk of apothecia being present in a soybean field, which helps growers predict the best timing for white mold treatment during the flowering period.

University research has indicated that the appearance of apothecia can be predicted using weather data and a threshold of percent soybean canopy row closure in a field. Based on these predictions and crop phenology, site-specific risk values are generated for three scenarios (non-irrigated soybeans, soybeans planted on 15″ row-spacing and irrigated, or soybeans planted on 30″ row-spacing and irrigated). Though not specifically tested we would expect row-spacings of 22 inches or less to have a similar probability response to fungicide as the 15 inch row-spacing.

The Sclerotinia apothecial models that underlie the Sporecaster prediction tool have undergone significant validation in both small test plots and in commercial production fields. In 2017, efficacy trials were conducted at agricultural research stations in Iowa, Michigan, and Wisconsin to identify fungicide application programs and thresholds for model implementation. Additionally, apothecial scouting and disease monitoring were conducted in a total of 60 commercial farmer fields in Michigan, Nebraska, and Wisconsin between 2016 and 2017 to evaluate model accuracy across the growing region. Across all irrigated and non-irrigated locations predictions during the soybean flowering period (R1 to early R4 growth stages) were found to explain end-of-season disease observations with an accuracy of 81.8% using the established probability thresholds now programmed in the app.

Click here to download the Android version of Sporecaster. 

Click here to download the iPhone version of Sporecaster.

Here is a helpful video if you would like some tips on how to use Sporecaster. If you would like some advice on how to interpret the output, we have created an additional short video on this subject.

What to Spray for White Mold?

If you have decided to spray soybeans for white mold, what are the best products to use? Over the last several years we have run numerous fungicide efficacy trials in Wisconsin and in conjunction with researchers in other states. In Wisconsin, we have observed that Endura applied at 8 oz at the R1 growth stage performs well. We have also observed that the fungicide Aproach applied at 9 fl oz at R1 and again at R3 also performs comparably to the Endura treatment. Other fungicide options also include Omega and Proline. You can view results of past fungicide evaluations by CLICKING HERE.

Some Other Resources

  1. For some other ideas on how to manage white mold you can visit this recent article.
  2. To find out how Xtend varieties respond against white mold, CLICK HERE.
  3. To watch an in-depth video on white mold management, CLICK HERE.

References

  1. Willbur, J.F., Fall, M.L., Blackwell, T., Bloomingdale, C.A., Byrne, A.M., Chapman, S.A., Holtz, D., Isard, S.A., Magarey, R.D., McCaghey, M., Mueller, B.D., Russo, J.M., Schlegel, J., Young, M., Chilvers, M.I., Mueller, D.S., and Smith, D.L.2018. Weather-based models for assessing the risk of Sclerotinia sclerotiorum apothecial presence in soybean (Glycine max) fields. Plant Disease.DOI:10.1094/PDIS-04-17-0504-RE
  2. Willbur, J.F.,Fall, M.L., Byrne, A.M., Chapman, S.A., McCaghey, M.M., Mueller, B.D., Schmidt, R., Chilvers, M.I., Mueller, D.S., Kabbage, M., Giesler, L.J., Conley, S.P., and Smith, D.L. 2018. Validating Sclerotinia sclerotiorumapothecial models to predict Sclerotinia stem rot in soybean (Glycine max) fields. Plant Disease. https://doi.org/10.1094/PDIS-02-18-0245-RE.
  3. Fall, M., Willbur, J., Smith, D.L., Byrne, A., and Chilvers, M. 2018. Spatiotemporal distribution pattern of Sclerotinia sclerotiorum apothecia is modulated by canopy closure and soil temperature in an irrigated soybean field. Phytopathology. https://doi.org/10.1094/PDIS-11-17-1821-RE.


New Video: Early Season Management Options for White Mold in Soybean

Damon Smith, Extension Field Crops Pathologist, Department of Plant Pathology, University of Wisconsin-Madison

In this video I visit a soybean field to talk about white mold, row spacing, planting population and the new Sporecaster white mold management smartphone app. in an effort to develop an integrated management strategy for white mold control.

A Look Into Soybean Checkoff Funded Collaborative International Research and Outreach

Damon Smith, Extension Field Crops Pathologist, Department of Plant Pathology, University of Wisconsin-Madison

Many public universities collaborate on international research and outreach efforts, but you may not understand the impact that this work can have even for farmers in the Midwest. We have assembled three new videos in a series, in an effort to demonstrate our impact in conducting collaborative research and outreach work. This work is ongoing and is being conducted in Chile and here in the Midwest. The focus is to produce soybean germplasm that is highly resistant to white mold, a major disease in the upper Midwest. This research is funded by the Wisconsin Soybean Marketing Board and the North Central Soybean Research Program. Travel support for graduate student, Megan McCaghey, was all made possible by the Walter R. Stevenson Fund for Graduate Student Travel. This collaborative effort includes researchers here at the University of Wisconsin-Madison and Researchers at Iowa State University, including Dr. Daren Mueller. We would like to thank Brandon Kleinke, Iowa State University, for his work in shooting video footage and assembling this video series. To watch the videos, click here.

New smartphone app: Sporecaster, The Soybean White Mold Forecaster

Damon Smith, Field Crops Extension Pathologist, University of Wisconsin-Madison

Roger Schmidt, Nutrient and Pest Management Program, University of Wisconsin-Madison

Shawn Conley, Soybean Extension Agronomist, University of Wisconsin-Madison

Sporecaster: A New Soybean White Mold Prediction App for your Smartphone

Sporecaster is a new smartphone application designed to help farmers predict the need for a fungicide application to control white mold in soybean. The app, which is free to use, was developed with support from the Wisconsin Soybean Association and Wisconsin Soybean Marketing Board. It was programmed by personnel in the UW-Madison Nutrient and Pest Management Program.

Sporecaster uses university research to turn a few simple taps on a smartphone screen into an instant forecast of the risk of apothecia being present in a soybean field, which helps growers predict the best timing for white mold treatment during the flowering period.

To learn more about the app, how to download and how to use it, click here.