Wisconsin Corn Tar Spot and General Disease Update – July 18, 2019

Damon Smith, Extension Field Crops Pathologist, Department of Plant Pathology, University of Wisconsin-Madison

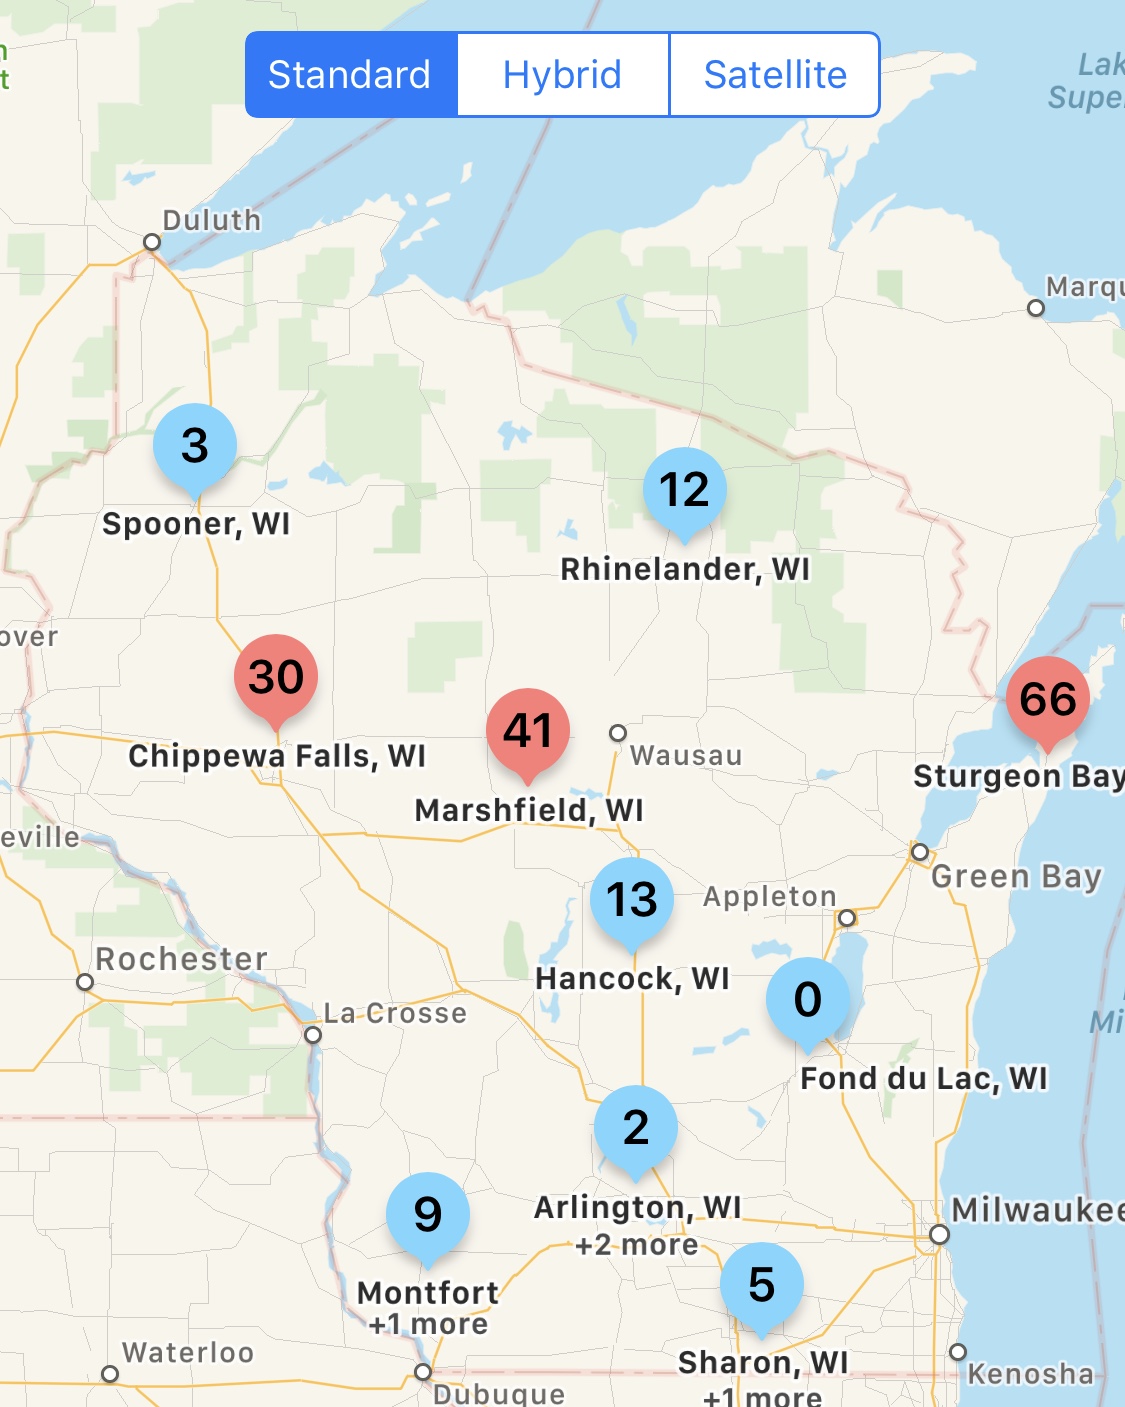
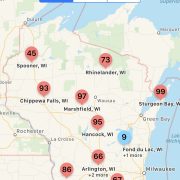
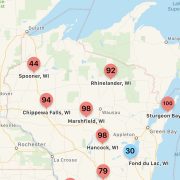
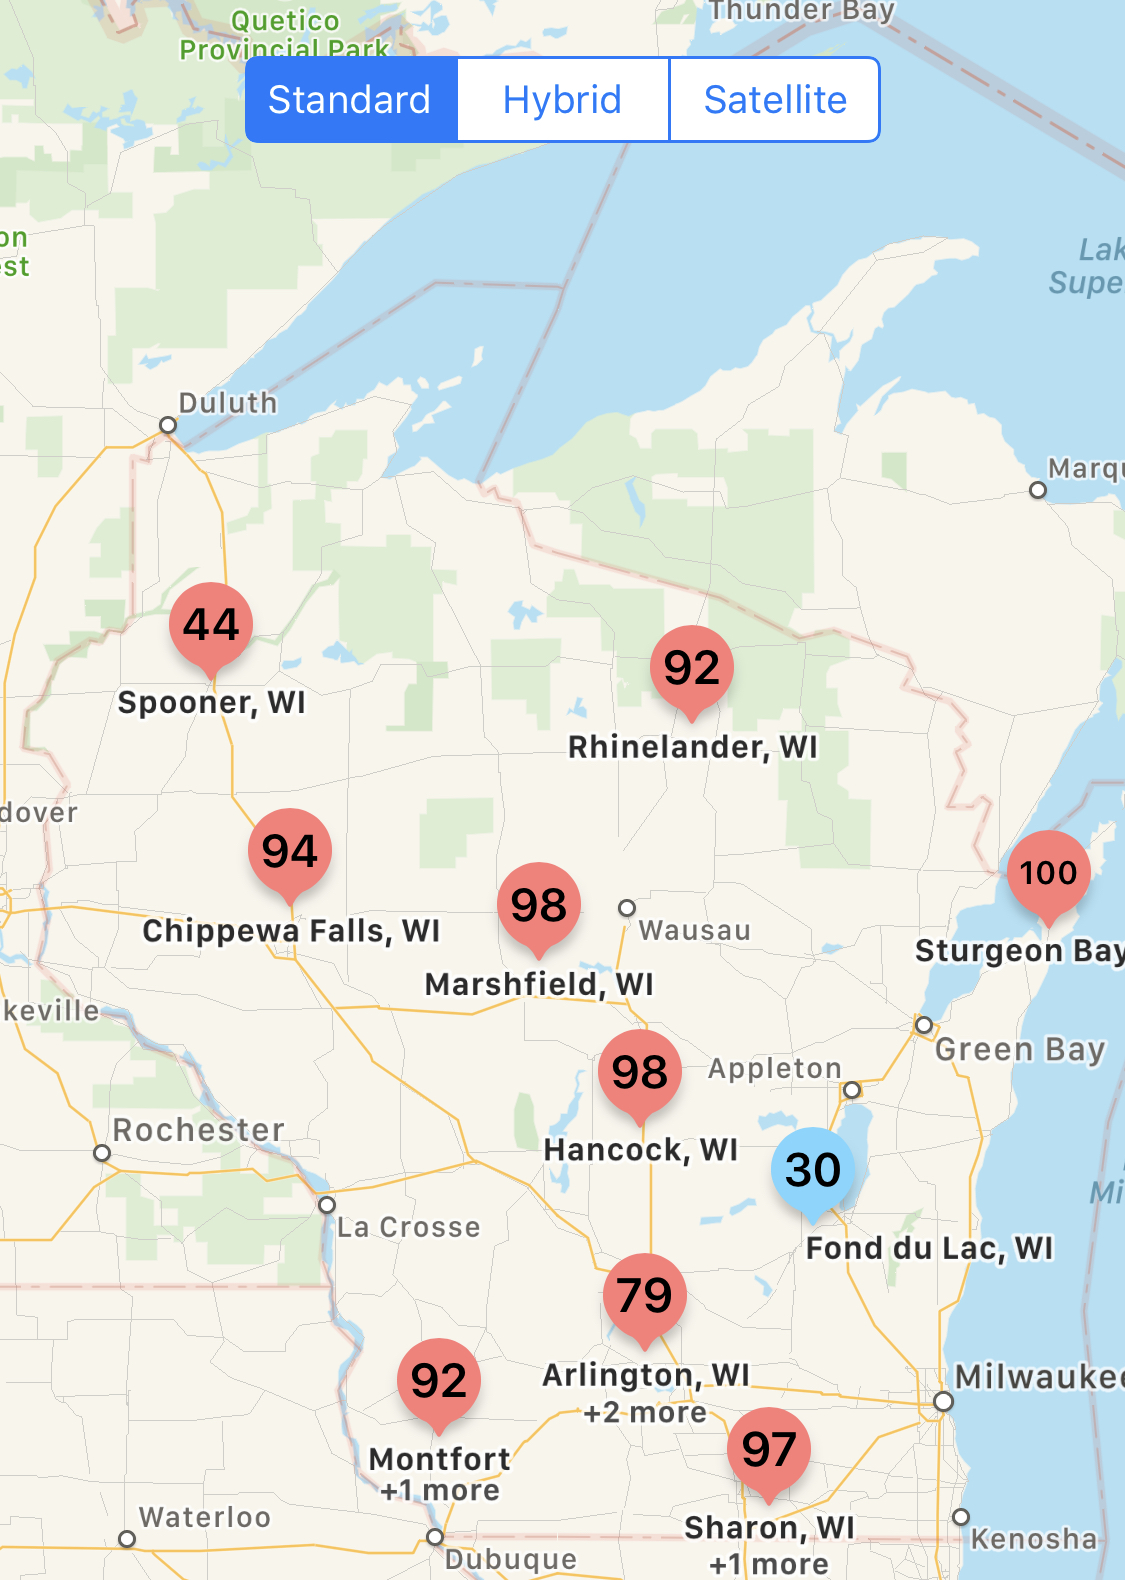
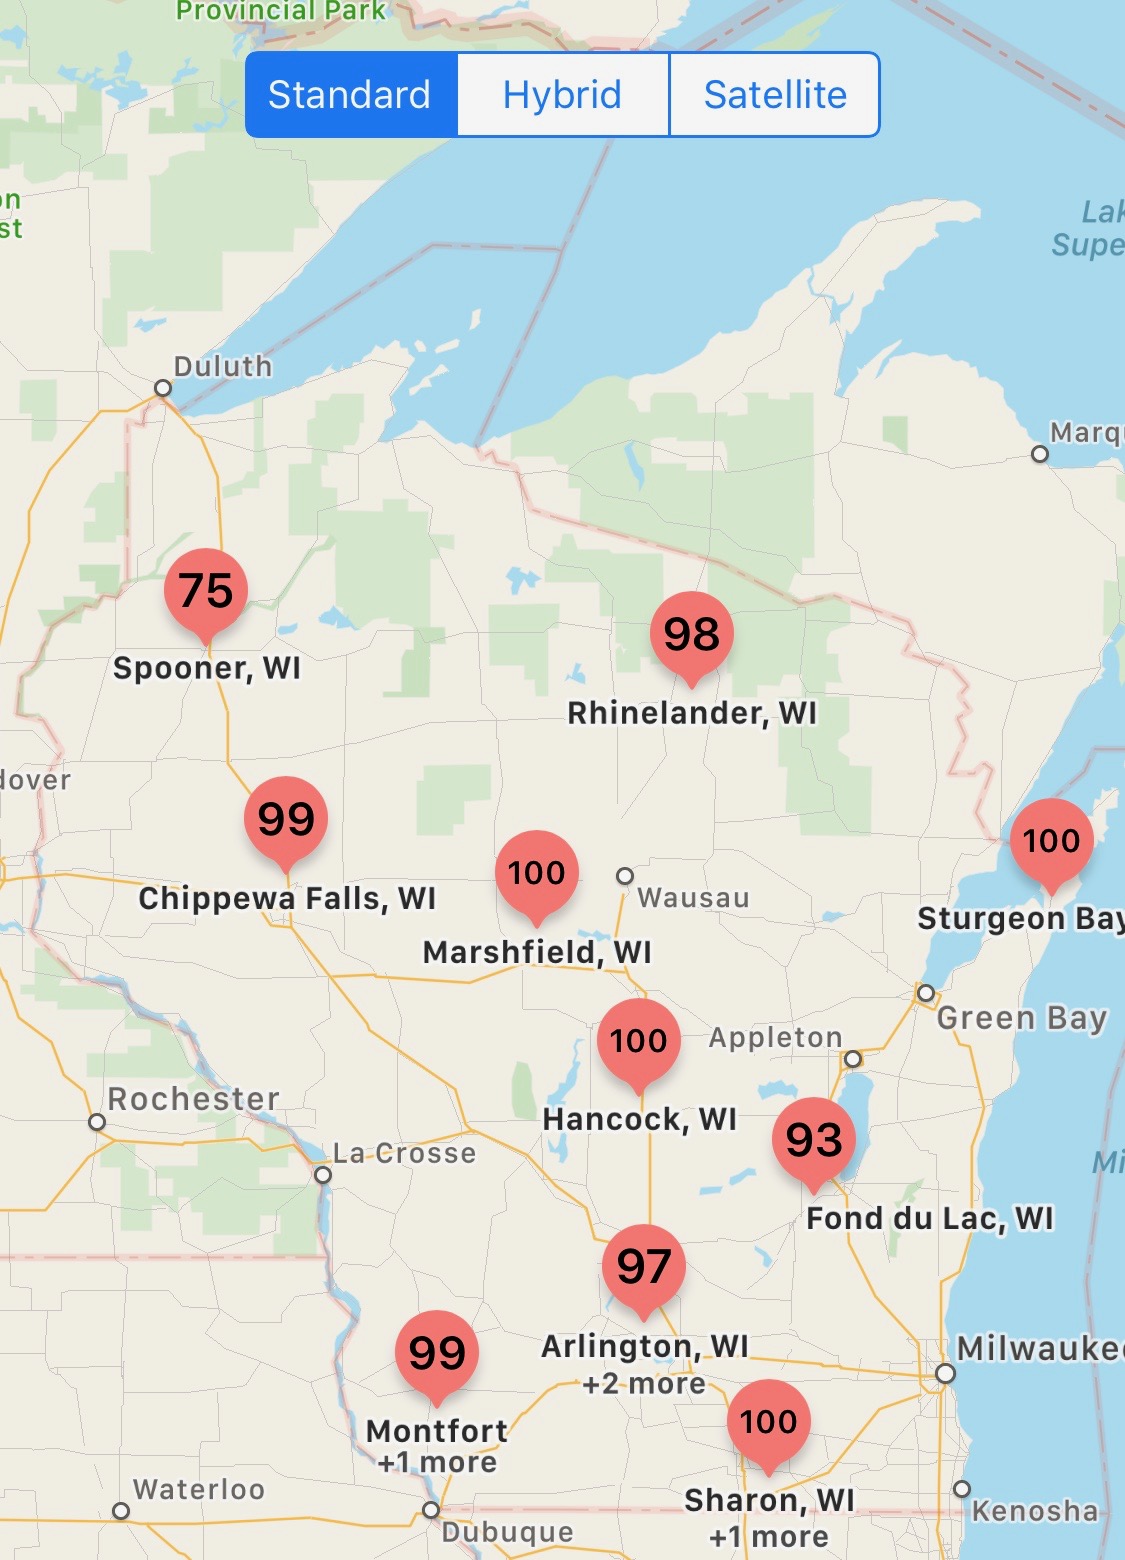
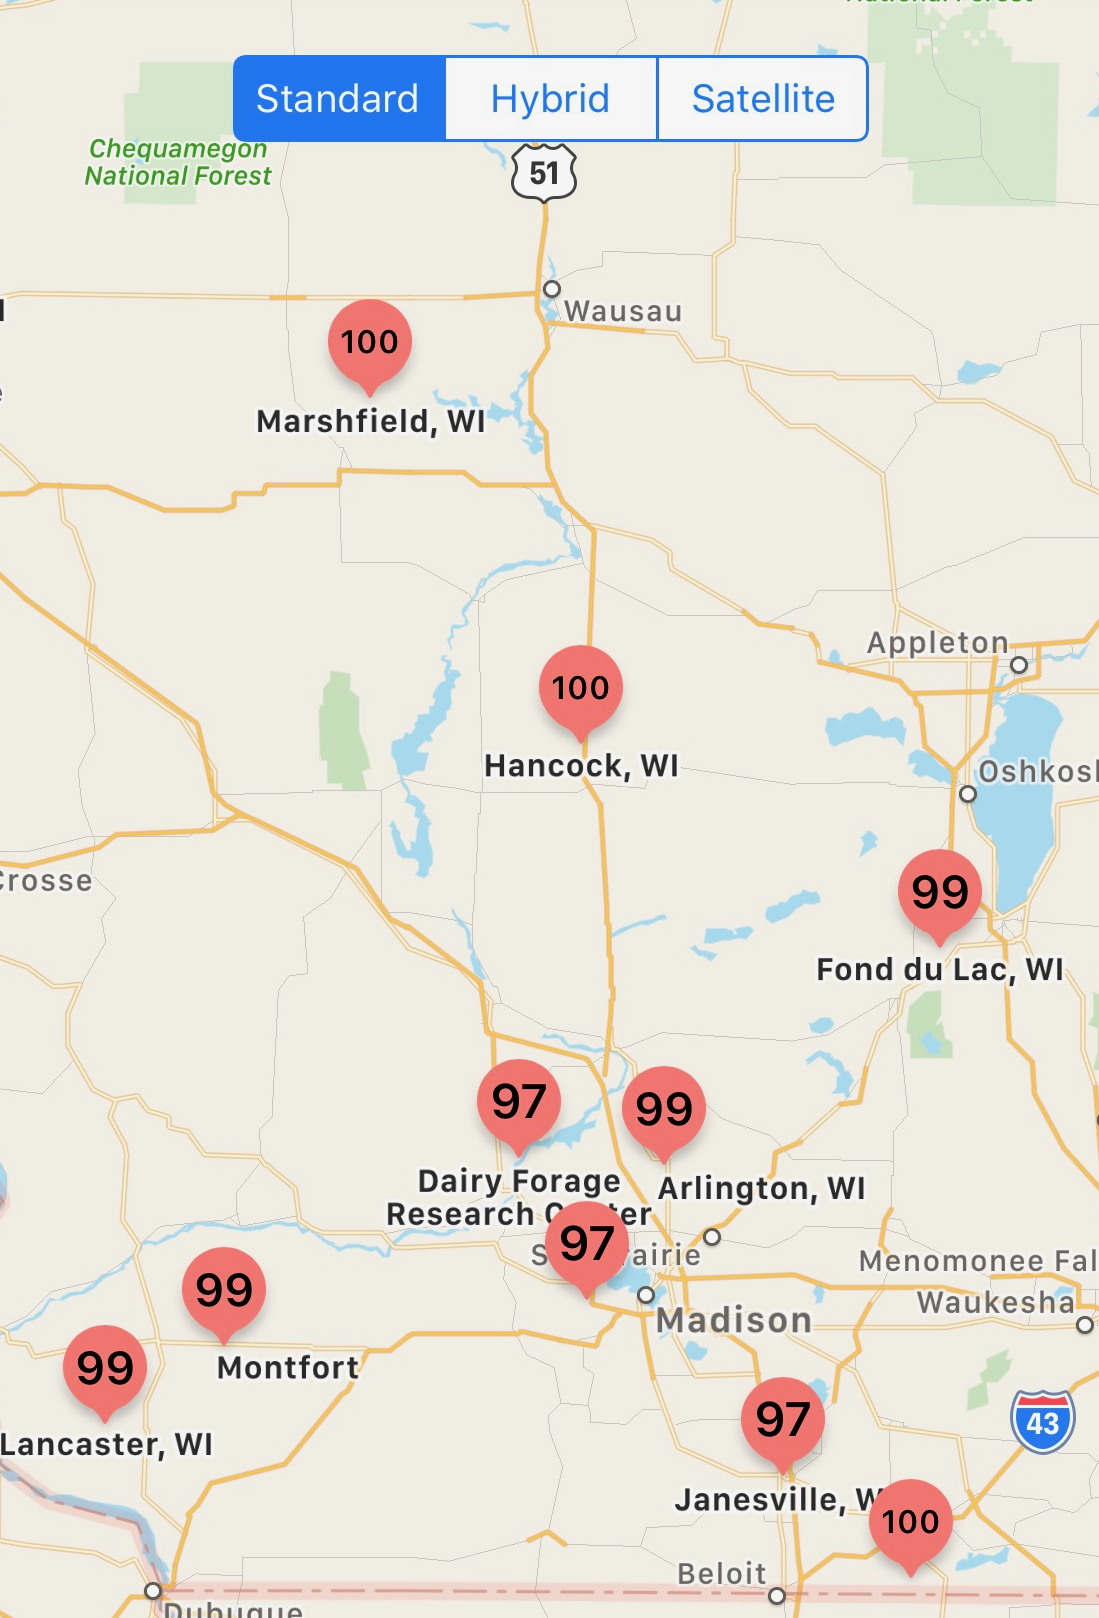
Figure 1. Tarspotter risk predictions for the state of Wisconsin on July 19, 2019.

Figure 1 shows the calculated risk from Tarspotter for July 19, 2019, for various locations in Wisconsin. As you can see, the present risk has dropped substantially over the past week, leaving much of the state at low risk. The drop is due to the high temperatures and drier conditions. Tar spot is favored by persistent temperatures between 60 and 70 F and high relative humidity averaging above 75% for a 30-day period. We have also scouted fields in southern and southwestern WI and have not found tar spot in our travels.

Gray Leaf Spot, Common Rust, and Northern Corn Leaf Blight, Oh My!

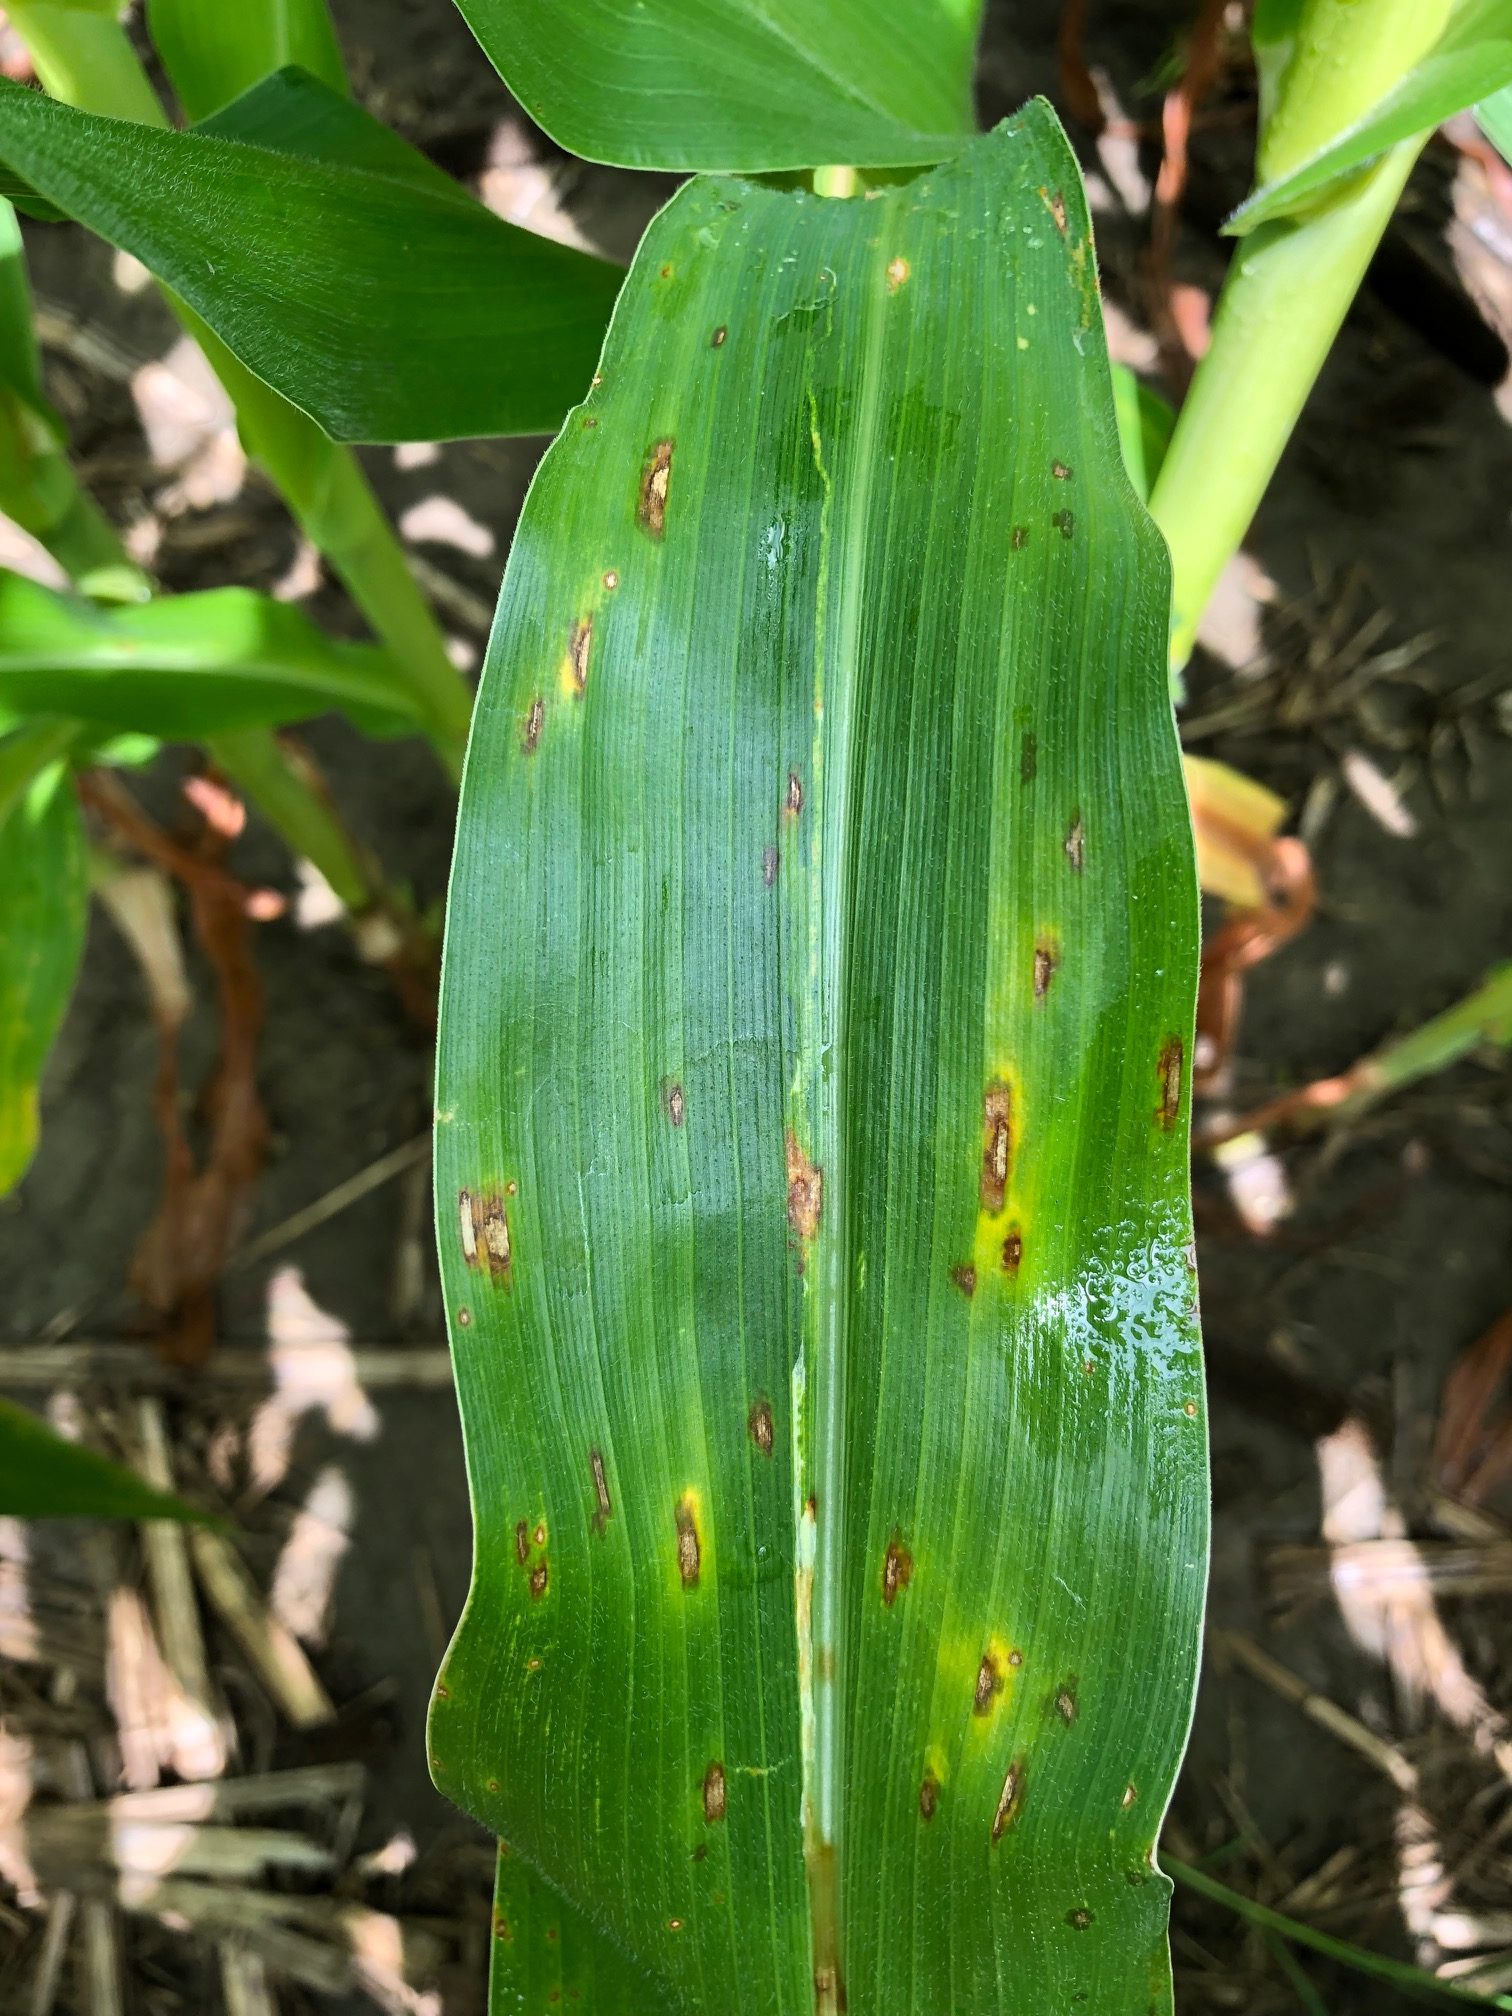
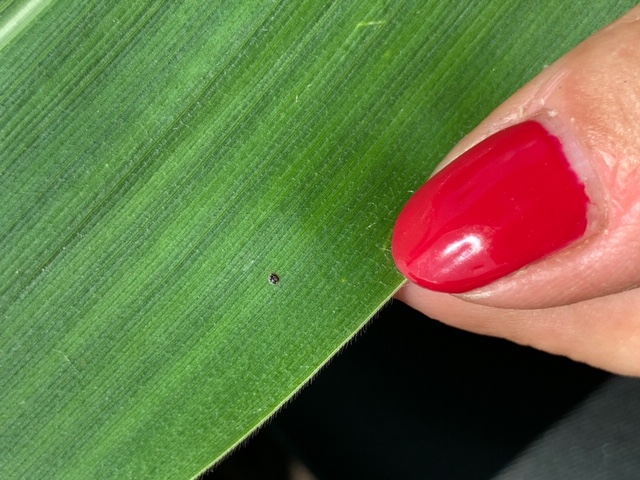
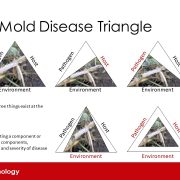
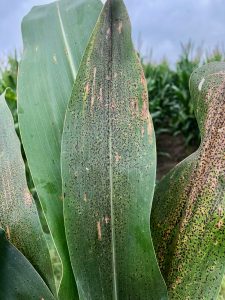
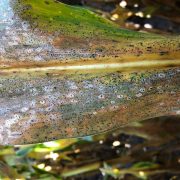
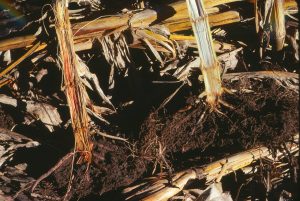
Figure 2. Gray leaf spot on a corn leaf.

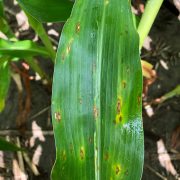
While scouting we have observed other foliar diseases of corn, including gray leaf spot (GLS: Fig. 2), common rust (Fig. 3), and northern corn leaf blight (NCLB; Fig. 4). Out fo these three, GLS has been the most consistent to find in fields we have visited. In Grant Co., GLS has made its way to the mid-canopy of some corn planted no-till in a field that had corn last season. It will be important to keep an eye on GLS and NCLB over the next couple of weeks. These two disease can become yield limiting if they reach the ear leaf of corn at high severity levels before the R3 corn growth stage. Scouting to determine the number of plants showing symptoms and the severity will be important in determining if a fungicide application at the tasseling growth stage is needed. Right now I’m most concerned about GLS and NCLB in field corn in Wisconsin, while keeping an eye out for tar spot.

What Should I Spray, and When Should I Spray for Corn Foliar Diseases In Wisconsin? Fungicide should be used to preserve yield and reduce disease level. There is no silver bullet fungicide out there for all corn diseases. However, there are many products which work well on a range of diseases. The 2019 Corn Fungicide Efficacy table lists products that have been rigorously evaluated in university research trials across the country. You can see there are several products listed that perform well on both NCLB and GLS along with efficacy against tar spot. So obviously, if a disease is present and you are trying to control the disease, you might expect more return on your investment, compared to simply spraying fungicide and hoping that there might be a yield increase.

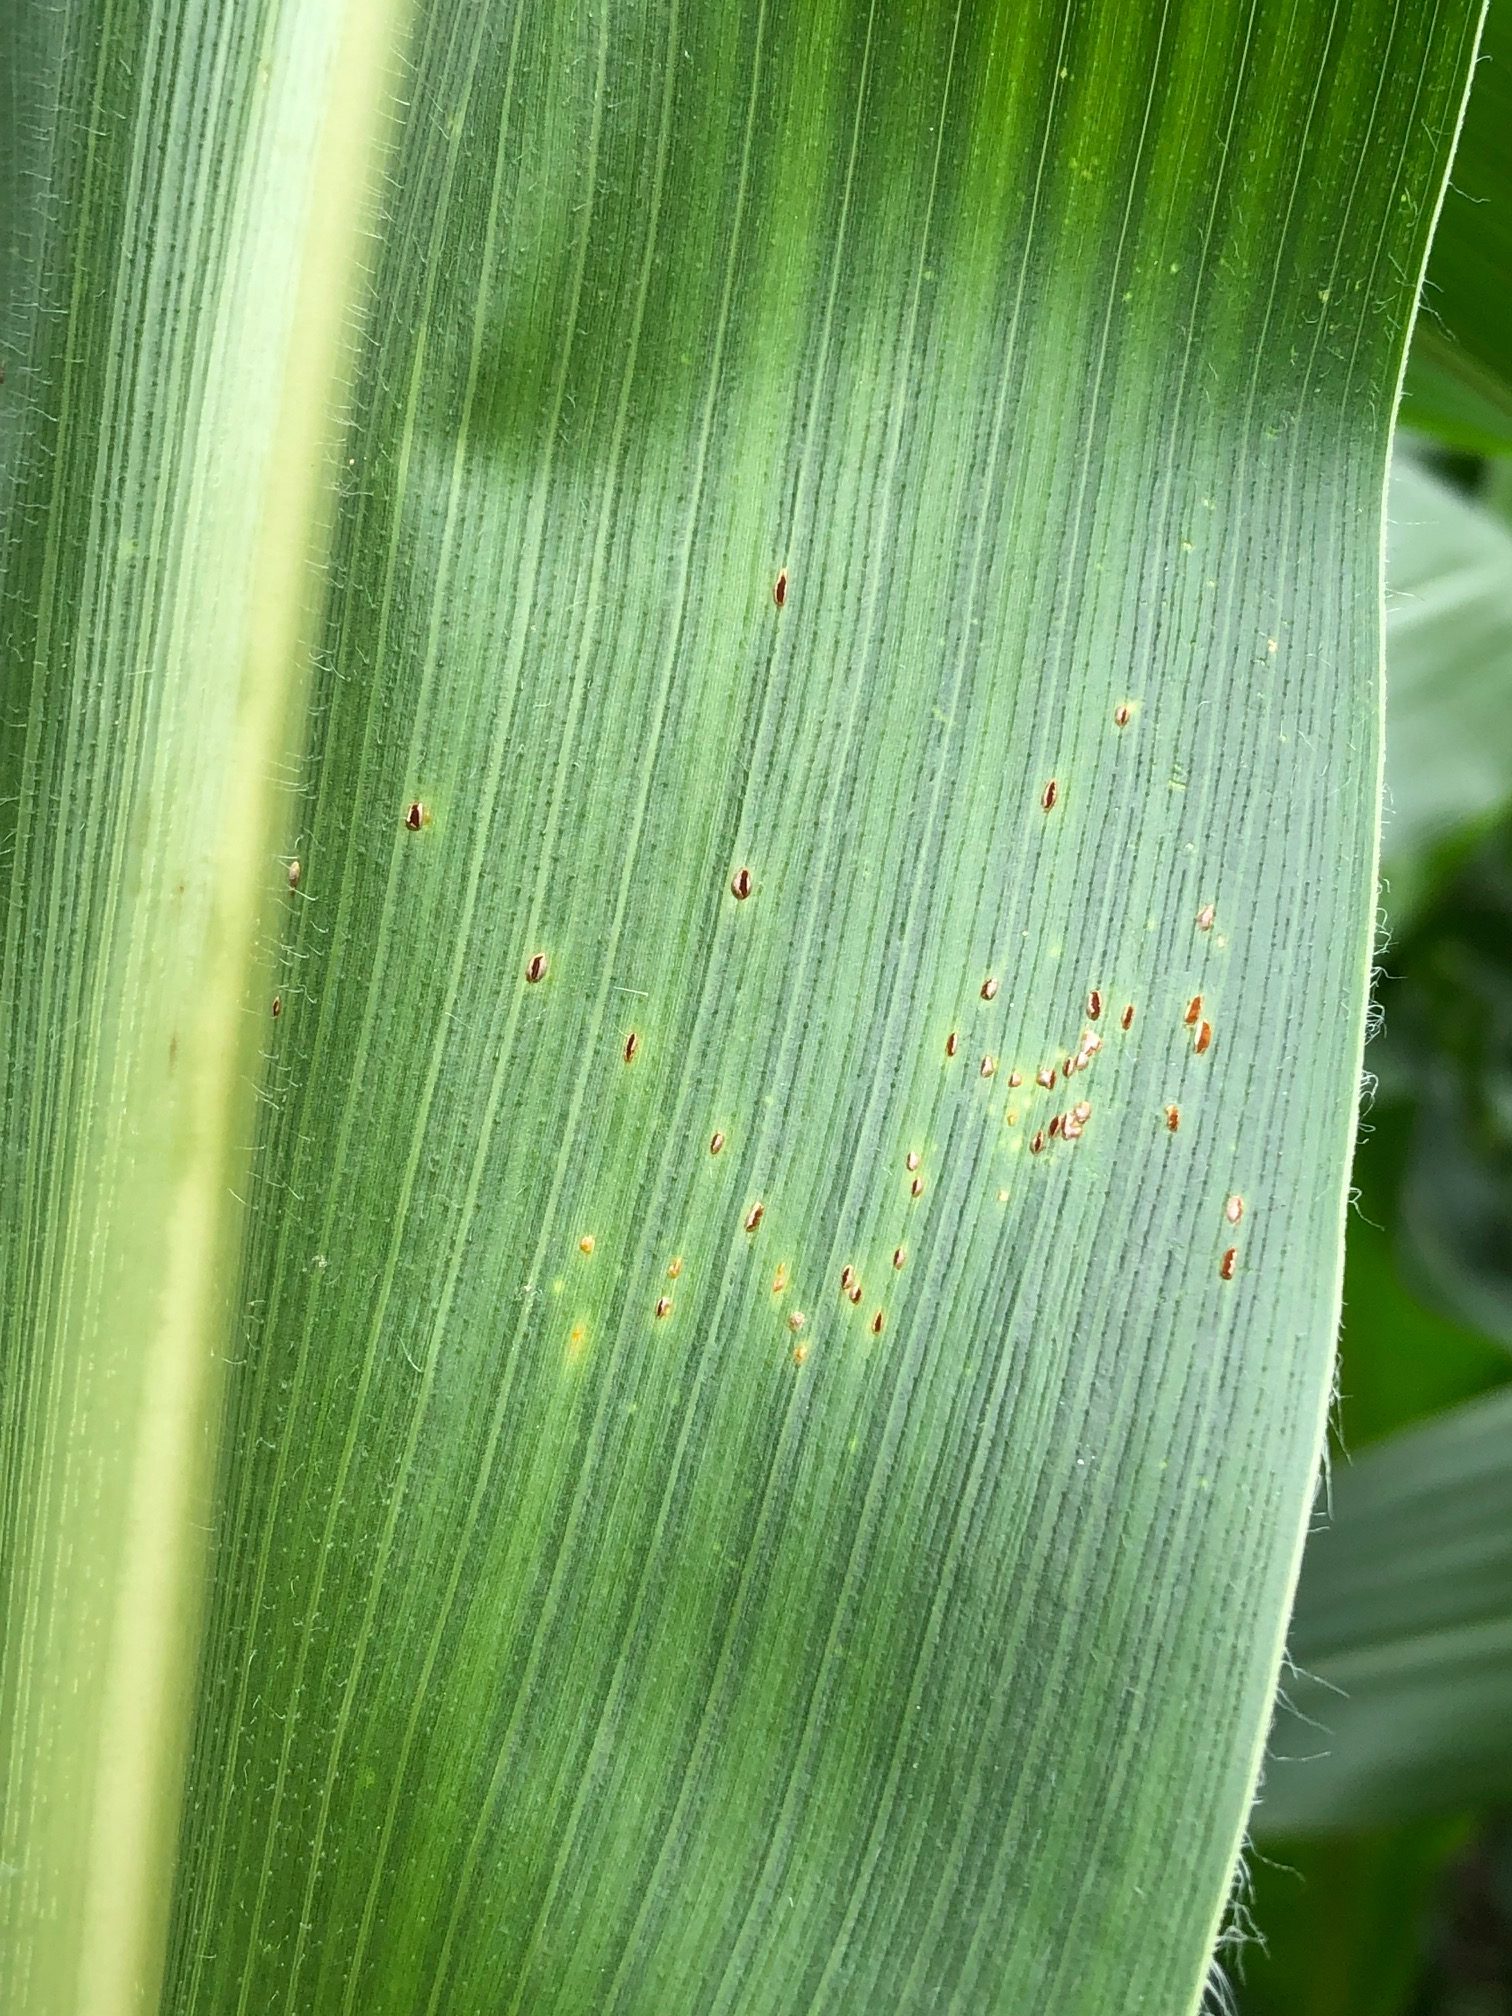
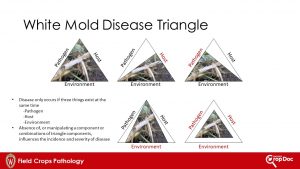
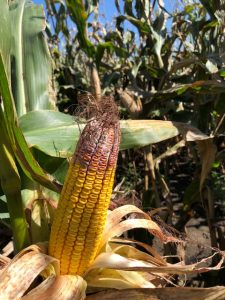
Figure 3. Common rust on a corn leaf.

Paul et al. (2011) conducted research to investigate the return on investment (ROI) of using fungicide at low and elevated levels of disease. Data from 14 states between 2002 and 2009 were used in the analysis. They looked at 4 formulations of fungicide products across all of these trials. I won’t go into detail about all products, but will focus on one here, pyraclostrobin. This is the active ingredient in Headline® Fungicide. In all, 172 trials were evaluated in the analysis and Paul et al. found that on average there was a 4.08 bu/acre increase in corn grain yield when pyraclostrobin was used. So there does appear to be some increase in yield with the use of fungicide over not treating across a range of environments. But in our current market, will this average gain cover the fungicide application? Today’s corn future price for September has a bushel of corn at $3.76.

Let’s Take a Closer Look at Corn Fungicide Return on Investment (ROI): While most of the early work on fungicide use in corn has focused on Headline® Fungicide, much of the industry has transitioned to using multi-mode-of-action products. These would be products mostly containing strobilurin (QoI) and triazole (DMI) fungicides in the same jug. Products such as Headline AMP® or Quilt Xcel® would fall into this category. These combination products have also been fairly consistent in response in my fungicide trials. You can find summaries of these trial results here. If we consider using Quit Xcel® at 10.5 fl oz or Headline AMP® at 10.0 fl oz, the list pricing of the product alone ranges from $15/acre (Quit Xcel®) to $22/acre (Headline AMP®). If the fungicide will be flown on with an aircraft, that cost will likely add nearly $15/acre to the application. Thus, fungicide plus application would range from $30/acre to $37/acre. If we can sell corn at $3.76 per bushel then we would need to preserve 8 bu/acre to nearly 10 bu/a in yield over not treating to break even! In a recent analysis of corn yield data where DMI+QOI products were applied at the tasseling period across the entire corn belt, the average yield preservation over not treating was 7.20 bu/a. This average projection is short of the 8 bu/a minimum we would need in the scenario above. However, the probability of preserving yield in the 8-10 bu/a range in this range is estimated to be 25% – 50%. This means that if we apply Quit Xcel® at 10.5 fl oz or Headline AMP® at 10.0 fl oz aerially, we will only break even 25% – 50% of the time with corn priced at $3.76 per bushel. If we can sell our corn for a better price or make the applications cheaper, then the odds will improve, but probably not climb above 70% even under the best case scenario. We do know that in Wisconsin, the odds of breaking even do improve if NCLB or GLS are active and increasing during the tasseling period. Get out there and scout!

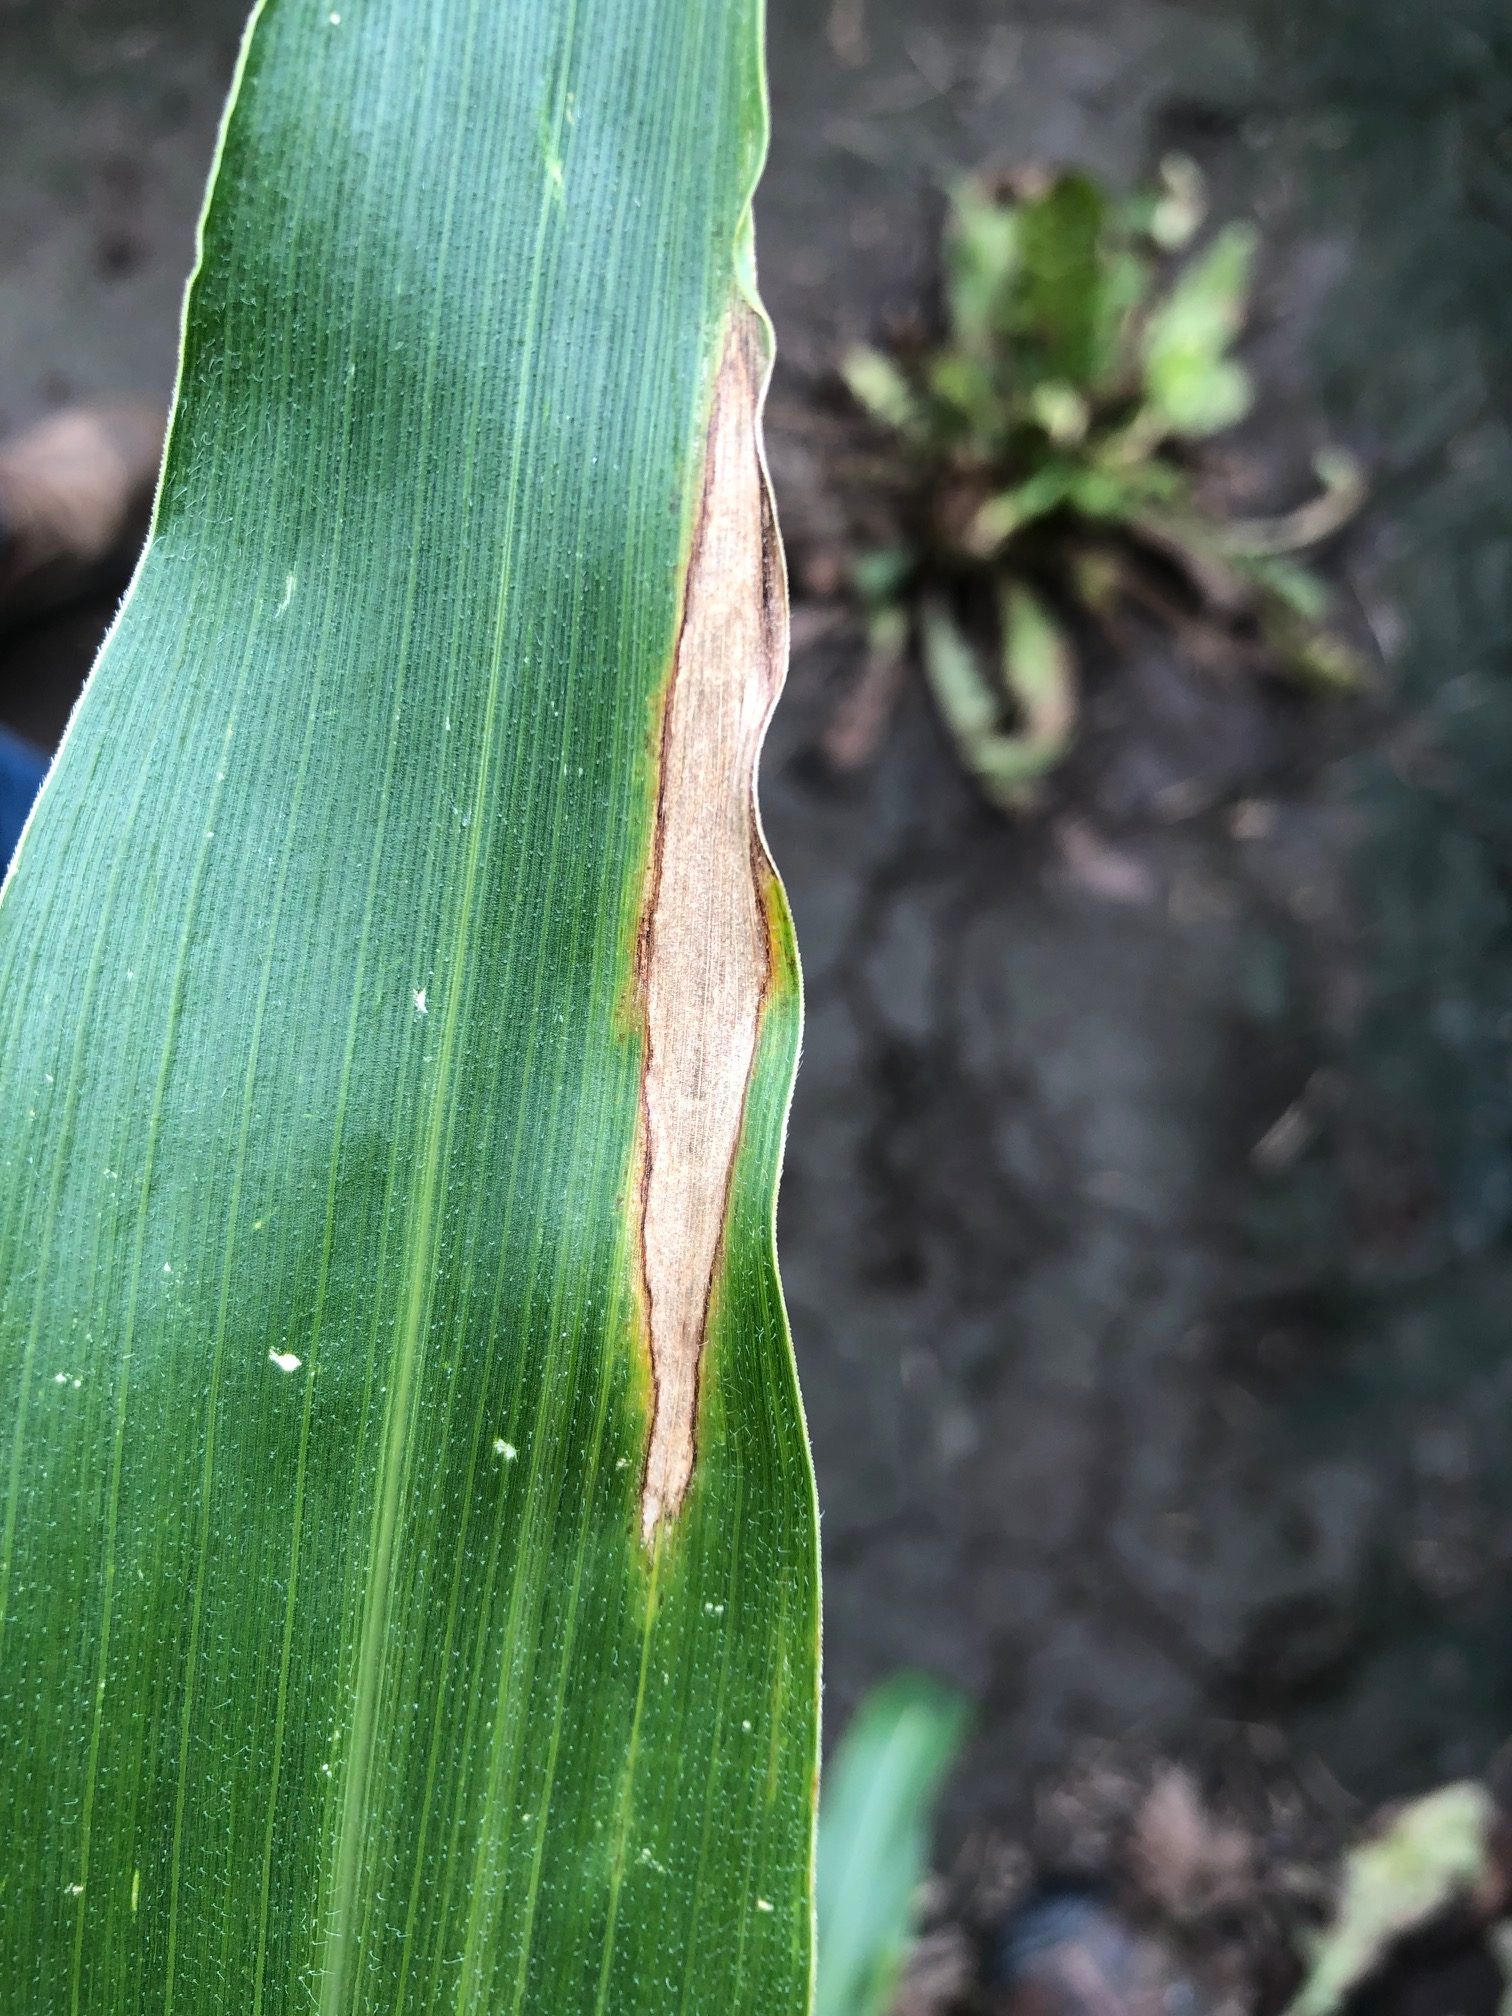
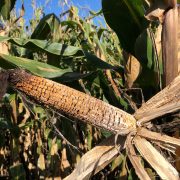
Figure 4. Northern corn leaf blight on a corn leaf.

So What About Fungicide Application Timing? We can investigate this question over the U.S. corn belt using the same dataset. Applications focused on an early (V6) timing, a VT-R2 timing, or a combination of V6 plus a VT-R2 application. Let’s again focus on the QoI+DMI products. Based on observations across the corn belt the V6 timing averaged almost 3 bu/a of preserved yield over not treating. The VT application resulted in nearly 8 bu/a in preserved yield, while the two-pass program only offered a little over 8 bu/a. Clearly the higher average yield preservation occurs using a single application of fungicide at the VT-R2 timing. Wisconsin data has been consistent with this observation. Thus it is recommended that a single application of fungicide be used around the VT-R2 growth stages, when NCLB or GLS are active and increasing on or near the ear leaves.

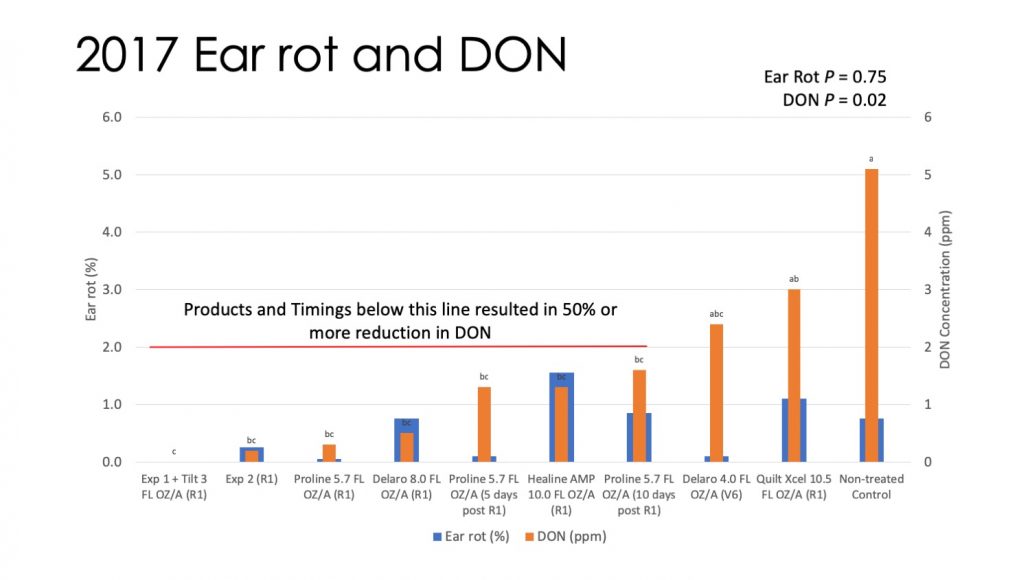
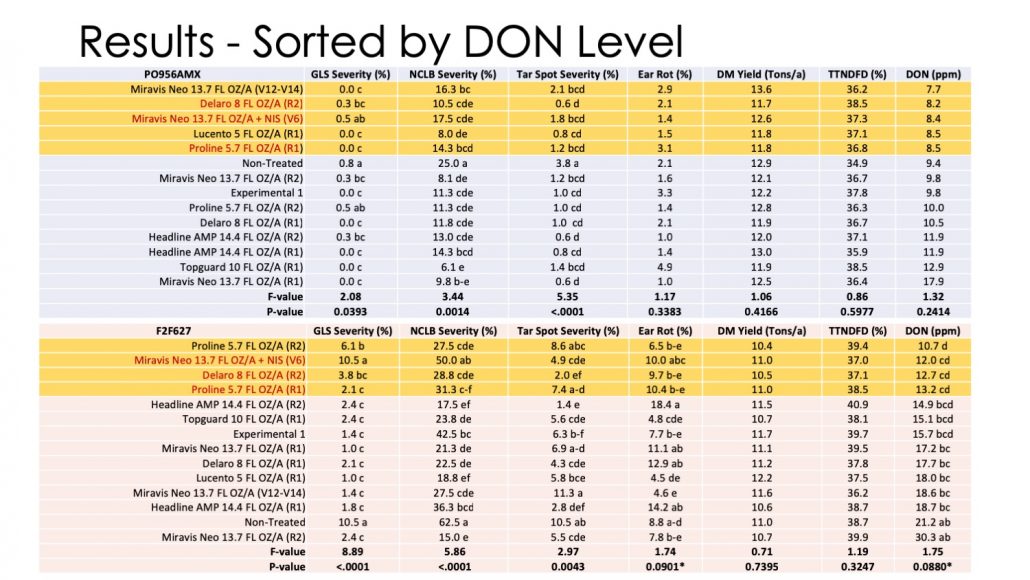
What About Silage Corn and Ear Rot? When it comes to ear rot control and reducing the accumulation of mycotoxins in grain or silage corn, fungicide application should be made when white silks are out. Spores of fungicide that generally cause mycotoxin issues in the grain portion of corn will infect the plant through silks. Thus, apply fungicides during silking or with 5 days after silking starts, can be beneficial. Note though that if the goal is to target mycotoxin production and reduce deoxynivalenol (DON) accumulation in the grain portion of the plant, Products containing a DMI should be used. Like winter wheat, the application of some QoI-containing fungicides can increase DON accumulation in the grain portion of corn plants. Some work has been done using Proline® to control Fusarium ear rot. This DMI only product has shown promise in reducing ear rot and DON accumulation in the grain portion of the corn plant and has a label for suppressing Fusarium ear rot in Wisconsin. Performance of some additional products in Wisconsin in a 2018 silage corn trial can be viewed by CLICKING HERE and scrolling down to pages 4 and 5.

Finally, be aware that in some cases, application of fungicide in combination with nonionic surfactant (NIS) at growth stages between V8 and VT in hybrid field corn can result in a phenomenon known as arrested ear development. The damage is thought to be caused by the combination of NIS and fungicide and not by the fungicide alone. To learn more about this issue, you can CLICK HERE and download a fact sheet from Purdue Extension that covers the topic nicely. Considering that the best response out of a fungicide application seems to be between VT-R2, and the issues with fungicide plus NIS application between V8 and VT, I would suggest holding off for any fungicide applications until at least VT.

Summary

As we approach the critical time to make decisions about in-season disease management on corn, it is important to consider all factors at play while trying to determine if a fungicide is right for your corn operation in 2019. Here is what you should consider:

1) Corn hybrid disease resistance score for NCLB and GLS – Resistant hybrids may not have high levels of disease which impact yield.

2) Get out of the truck and SCOUT, SCOUT, SCOUT – Consider how much disease and the level of severity of disease present in the lower canopy prior to tassel.

3) Consider weather conditions prior to, and during, the VT-R2 growth stages – if weather is conducive for NCLB or GLS, disease may continue to increase in corn and a fungicide application might be necessary. If it turns out to be hot and dry, disease development will stop and a fungicide application would not be needed.

4) Consider your costs to apply a fungicide and the price you can sell your corn grain – Will you preserve enough yield out of the fungicide application to cover its cost?

5) Hold off with making your fungicide application in Wisconsin until corn has reached the VT-R2 growth stages – The best foliar disease control and highest likelihood of a positive ROI will occur when fungicide is applied during this timing when high levels of disease are likely.

6) Be aware that every time you use a fungicide you are likely selecting for corn pathogen populations that will become resistant to a future fungicide application – Make sure your fungicide application is worth this long-term risk. See fact sheet A3878 below for more information.

Other Resources

Video: Disease Management in Low-Margin Years (fast forward to 10:00 for corn information)

Fact Sheet: A4137 – Grain Management Considerations in Low-Margin Years

Fact Sheet: A3878 – Fungicide Resistance Management in Corn, Soybeans, and Wheat in Wisconsin

References

Munkvold, G.P. and White, D.G., editors. 2016. Compendium of Corn Diseases, Fourth Edition. APS Press.

Paul, P. A., Madden, L. V., Bradley, C. A., Robertson, A. E., Munkvold, G. P., Shaner, G., Wise, K. A., Malvick, D. K., Allen, T. W., Grybauskas, A., Vincelli, P., and Esker, P. 2011. Meta-analysis of yield response of hybrid field corn to foliar fungicides in the U.S. Corn Belt. Phytopathology 101:1122-1132.

Wise, K., Mueller, D., Sisson, A., Smith, D., Bradley, and Robertson, A., editors. 2016. A Farmer’s Guide to Corn Diseases. APS Press.

Wisconsin Corn Tar Spot Update for July 11, 2019 – Frass Happens!

Damon Smith, Extension Field Crops Pathologist, Department of Plant Pathology, University of Wisconsin-Madison

Figure 1. Tarspotter risk predictions for the state of Wisconsin on July 11, 2019.

Figure 1 shows the calculated risk from Tarspotter for July 11, 2019, for various locations in Wisconsin. Figure 2 shows the risk for locations in southern and south-central Wisconsin. As you can see, the present risk remains generally high for tar spot development in all locations examined. However, risk percentages have dropped over the last week, for the most part. The continued elevated risk is due to the fact that the humidity was high over the last weekend, despite warmer temperatures. As temperatures climb and conditions remain dry, expect risk to decline. Tar spot is favored by persistent temperatures between 60 and 70 F and high relative humidity averaging above 75% for a 30-day period.

Frass Happens!

Figure 2. Tarspotter risk predictions for southern Wisconsin on July 11, 2019.

That’s right folks, frass or bug poop is a common reality in corn fields. With all of the hype concerning tar spot, it has gotten folks out scouting corn. This is a good thing. However, we have received many samples in our diagnostic clinic that were submitted for tar spot confirmation. So far, these have all been confirmed to be insect frass or bug poop (Fig. 3). We have also scouted fields in Dane co., Walworth Co., Grant Co., and Lafayette Co. and have not observed tar spot in any fields visited. We have seen lots of insect frass though.

How can you tell if it is bug poop and not tar spot? Use a little spit or some water from a water bottle. Wet the leaf and lightly rub.  Bug poop will come off, tar spot will not. In addition, tar spot spots will be raised and can be felt when you rub your finger across the black spot. Frass generally won’t feel like it is raised. Continue to scout and send samples. It is always better to get a confirmation, before you spray. If it is nothing to worry about, you can save the trip and the money!

The Current Recommendation

Figure 3. Insect frass (a.k.a bug poop) on the surface of a corn leaf. Photo Credit: Roger Schmidt.

While weather continues to be mostly conducive for tar spot, evaluate the likelihood that tar spot might develop in your field. Remember, if you have no history of the disease, then the likelihood of local inoculum being present is low. Saving the fungicide application for as as close to tassel or white silking periods will be the best option resulting in the highest return on the fungicide investment. If you have a history and you know you have a susceptible hybrid coupled with a no-till situation, then the risk is higher and you need to evaluate the economics of doing an application of fungicide as early as V6. Remember, if you do a V6-V8 application of fungicide, conditions could stay conducive later in the season for tar spot. Those early applications will “burn out” by the time the tasseling period rolls around. So if you do put a fungicide spray on at V6, you might have to come back at VT with another application to protect plants during the reproductive phase, should we stay in favorable conditions for tar spot. Keep an eye on the weather and keep scouting!

More Tar Spot Information

  1. Tar spot Fact sheet
  2. Short Tar Spot Video
  3. Tar Spot Webinar 
  4. Corn Fungicide Efficacy Table

Wisconsin Corn Tar Spot Update – July 3, 2019

Damon Smith, Extension Field Crops Pathologist, Department of Plant Pathology, University of Wisconsin-Madison

Figure 1. Tarspotter risk predictions for the state of Wisconsin on July 3, 2019.

Figure 1 shows the calculated risk from Tarspotter for July 3, 2019, for various locations in Wisconsin. Figure 2 shows the risk for locations in southern and south-central Wisconsin. As you can see, the present risk remains generally high for tar spot development in all locations examined. This is due to the fact that the weather continues to be relatively wet and humid for the past 30 days across the entire state. Tar spot is favored by persistent temperatures between 60 and 70 F and high relative humidity averaging above 75% for a 30-day period. We have been right in the zone for conducive conditions for this disease.

We have also spent the last few days scouting corn in Walworth Co., Grant Co., and Lafayette Co. Some of these fields are planted to known tar spot-susceptible hybrids and planted in fields with a history of the disease. We have been unable to find any symptoms of tar spot. Fields generally look disease free with just a bit of Anthracnose, which is common this time of year.

The Recommendation

Figure 2. Tarspotter risk predictions for southern Wisconsin on July 3, 2019.

While weather continues to be conducive for tar spot, evaluate the likelihood that tar spot might develop early in your field. Remember, if you have no history of the disease, then the likelihood of local inoculum being present is low. Saving the fungicide application for later in the season might be a better option. If you have a history and you know you have a susceptible hybrid coupled with a no-till situation, then the risk is higher and you need to evaluate the economics of doing an application of fungicide as early as V6. Remember, if you do a V6-V8 application of fungicide, conditions could stay conducive later in the season for tar spot. Those early applications will “burn out” by the time the tasseling period rolls around. So if you do put a fungicide spray on at V6, you might have to come back at VT with another application to protect plants during the reproductive phase, should we stay in favorable conditions for tar spot. Keep an eye on the weather and keep scouting!

More Tar Spot Information

  1. Tar spot Fact sheet
  2. Short Tar Spot Video
  3. Tar Spot Webinar 
  4. Corn Fungicide Efficacy Table

Wisconsin Tar Spot Update – June 25, 2019

Damon Smith, Extension Field Crops Pathologist, Department of Plant Pathology, University of Wisconsin-Madison

Figure 1. Tarspotter risk predictions for the state of Wisconsin on June 25, 2019.

Figure 1 shows the calculated risk from Tarspotter for June 25, 2019, for various locations in Wisconsin. Figure 2 provides a zoomed view for southern and south-central Wisconsin. As you can see, the present risk is very high for tar spot development in all locations examined. This is due to the fact that the weather continues to be relatively cool and wet for the past 30 days across the entire state. Tar spot is favored by persistent temperatures between 60 and 70 F and high relative humidity averaging above 75% for a 30-day period. We have been right in the zone for conducive conditions for this disease.

The Recommendation

Figure 2. Tarspotter risk predictions for southern Wisconsin on June 25, 2019.

While weather continues to be conducive for tar spot, evaluate the likelihood that tar spot might develop early in your field. Remember, if you have no history of the disease, then the likelihood of local inoculum being present is low. Saving the fungicide application for later in the season might be a better option. If you have a history and you know you have a susceptible hybrid coupled with a no-till situation, then the risk is higher and you need to evaluate the economics of doing an application of fungicide as early as V6. Remember, if you do a V6-V8 application of fungicide, conditions could stay conducive later in the season for tar spot. Those early applications will “burn out” by the time the tasseling period rolls around. So if you do put a fungicide spray on at V6, you might have to come back at VT with another application to protect plants during the reproductive phase, should we stay in favorable conditions for tar spot. Keep an eye on the weather and keep scouting!

More Tar Spot Information

  1. Tar spot Fact sheet
  2. Short Tar Spot Video
  3. Tar Spot Webinar 
  4. Corn Fungicide Efficacy Table

Tar Spot on My Mind

Figure 1. Tarspotter risk predictions for the state of Wisconsin on June 19, 2019.

Damon Smith, Extension Field Crops Pathologist, Department of Plant Pathology, University of Wisconsin-Madison

Tar spot seems to be on everyone’s mind now that corn planting is nearing the finish line. The challenging spring and wet weather has folks now focused on the various disease issues that might be in front of us if we stay in this cool and rainy pattern in Wisconsin. I addressed this concern in an article earlier this season, and tar spot is certainly a disease that could be significant if the weather stays wet and cool.

As many are aware, we have worked with a group of plant pathologists in the Midwest during the winter of 2019 to develop a tar spot prediction tool. The model that runs the tool is based on data from the Arlington Agricultural Research Station located in Arlington, WI and data from a single location in Michigan. Data from several fungicide trials were used to generate probability-based prediction models for tar spot epidemics. The framework of the models follows that of our previous models for soybean, which run the Sporecaster application. However, the weather information and predictor variables have been changed based on our work in corn in 2018. While the preliminary smartphone application, called Tarspotter, has been programmed it needs to be validated in replicated studies and in observational studies to determine the accuracy. Thus, Tarspotter is not publicly available and is being tested by extension and industry colleagues during the 2019 season. With that said, I will provide an outlook based on the calculated risk and my interpretation of the risk for Wisconsin during the season.

What is the Present Risk For Tar Spot Development?

Figure 2. Tarspotter risk predictions for southern Wisconsin on June 19, 2019.

Figure 1 shows the calculated risk from Tarspotter for June 19, 2019, for various locations in Wisconsin. Figure 2 provides a zoomed view for southern and south-central Wisconsin. As you can see, the present risk is very high for tar spot development in all locations examined. This is due to the fact that the weather has been extremely cool and wet for the past 30 days across the entire state. Tar spot is favored by persistent temperatures between 60 and 70 F and high relative humidity averaging above 75% for a 30-day period. We have been right in the zone for conducive conditions for this disease.

Should I Spray Fungicide Now on My Corn in Wisconsin?

The short answer is NO! While the weather has been conducive for tar spot, corn is still very young. We would not recommend spraying corn for any foliar disease any earlier than V6. In fact, I would urge folks to hold off as long as they can toward VT to make a fungicide application. Some things to consider in this decision to spray fungicide for tar spot at V6 would be the field history. Has tar spot ever been found in a field? If not, then there is presumed to be no local inoculum available for infection, even if conditions are conducive (remember that the disease triangle is important). In fields with no history of tar spot, scout regularly and monitor the risk maps and what we are recommending based on our observations. You might be able to hold off longer on that fungicide application and get it on at VT where a return on your fungicide investment is more likely. If you have had a history of tar spot and you know that you have a hybrid that is more susceptible and there is a large amount of infested residue, then you should monitor this situation closely. Remember that the first 4 or 5 leaves on a corn plant don’t contribute to yield. In fact the corn plant will soon get rid of those leaves, as the adult leaves emerge and the stalk elongates. Thus protecting leaves prior to V6 or V8 really doesn’t make a lot of economic sense (let alone biological sense for the Midwest). If you have had a history of the disease, conditions remain conducive, and the crop is V6-V8 or later, a fungicide application might make sense. Weigh the economics of this application and shop around. There are many products that have demonstrated decent efficacy toward tar spot. You can find our 2018 fungicide test summaries by CLICKING HERE and scrolling down to pages 2-7.

The Summary

While weather has been conducive for tar spot over the last month, do a little homework and evaluate the likelihood that tar spot might develop early in your field. Remember, if you have no history of the disease, then the likelihood of local inoculum being present is low. Saving the fungicide application for later in the season might be a better option. If you have a history and you know you have a susceptible hybrid coupled with a no-till situation, then the risk is higher and you need to evaluate the economics of doing an application of fungicide as early as V6. Remember, if you do a V6-V8 application of fungicide, conditions could stay conducive later in the season for tar spot. Those early applications will “burn out” but the time the tasseling period rolls around. So if you do put a fungicide spray on at V6, you might have to come back at VT with another application to protect plants during the reproductive phase, should we stay in favorable conditions for tar spot. Keep an eye on the weather and keep scouting!

More Tar Spot Information

  1. Tar spot Fact sheet
  2. Short Tar Spot Video
  3. Tar Spot Webinar 
  4. Corn Fungicide Efficacy Table


How Will Delayed Planting Influence Crop Diseases in 2019?

Damon Smith, Extension Field Crops Pathologist, University of Wisconsin-Madison

Darcy Telenko, Extension Field Crops Pathologist, Purdue University

Figure 1. The Disease Triangle Concept

We keep getting this question, because as we write this, it is storming yet again in many locations in the Midwest. Rain, rain, and more rain has pushed back timely planting everywhere. Concern is starting to mount about not only yield loss simply from delayed planting, but what increased risk of yield loss due to disease there might be in 2019. As we consider this issue, we will use tar spot of corn and white mold of soybean as just two examples of where this could be an issue.

The Plant Disease Triangle. Remember that the plant disease triangle is the foundation for understanding how plant diseases develop and how to manage them. In order for a plant disease to occur you must have a virulent pathogen, a susceptible host plant, and favorable weather conditions to coincide at the same time. If any one of these three components is missing (or we implement a management strategy that removes or reduces one component) then a plant disease will not occur. When it comes to the host component, it not only matters that the host is generally susceptible but is also at a susceptible growth stage. Consider white mold of soybeans for a minute. All stages of soybean are susceptible to infection by the white mold fungus, but most infections occur through open flowers. Thus, the disease triangle is met when you have (1)white mold fungal spores flying around at the same time that (2)soybean flowers are open (susceptible stage), during, (3) cool and wet weather (favorable environmental condition)completing the triangle (Figure 1). The point here is that if we continue in a cool wet pattern, and delayed planting continues, we may quickly find ourselves with crops at susceptible growth stages when the weather is very conducive to disease.

Figure 2. White Mold in a Soybean Field

Delayed Planting and White Mold of Soybean. In 2017, we had an epic epidemic of white mold on soybean across the upper Midwest (Figure 2). One of the main reasons that the epidemic was so bad is that it was generally cool for a large portion of the season. This resulted in soybeans that moved very slowly from one growth stage to the next. When it came to flowering, soybeans bloomed for an extended period of time. This left them in a susceptible growth stage for about twice as long as normal. These cool conditions also coincided with wet weather that was favorable for the pathogen. In 2018, planting occurred reasonably on-time and we accumulated heat units quickly. Bloom started early in the season and was about half as long as it was in 2017. This meant that soybeans “escaped” infection in large portions of the upper Midwest. Fast-forward to 2019. If this cool rainy cycle persists, and planting is delayed, then soybeans may bloom later and over an extended period of time during wet/humid weather conditions. Keeping an eye on weather before and during the soybean bloom period along with consulting the Sporecaster smartphone app  can help you make the educated decision to spray fungicide or not.

Figure 3. Tar Spot Signs and Symptoms on Corn Leaves

Delayed Planting and Tar Spot of Corn. In 2018 Tar spot of corn (Figure 3) created quite a stir. The epidemic was widespread and caused some significant yield losses in areas that it occurred. The tar spot fungus is residue-borne. There is also decent evidence that it can survive over-winter on corn residue (Figure 4). Our laboratories have been investigating tar spot fungal survival on corn residue collected after snow-melt in Wisconsin and Indiana. Regardless of whether there was fall tillage performed or not, survival of tar spot fungal spores (ascospores) on the residue collected ranged between 15 and 40%, with an average around 20%. These are VERY preliminary findings (and the numbers might change once we finish counting and analyzing data), but the point is that there is viable tar spot fungal inoculum present in Midwest corn fields. Therefore, one component of the triangle is met! As for the other two components, corn is being planted later than normal and conditions are cool and wet. Again, if this cycle of cool and wet holds, conditions will be favorable for the fungus. Delayed planting of corn will also push corn into conducive growth stages for the fungus to infect and cause heavy yield losses (although, we have seen infection at all growth stages as long as there was green tissue available). One of the reasons that the 2018 tar spot epidemic was so significant, was that many areas of the upper Midwest had cool and excessively wet conditions around the V6 growth stage and again near or after the VT growth stages. When foliar diseases of corn start at early growth stages (V6 or V8) the risk for yield loss can be much higher than if they start after R2 or brown silk. Keep an eye on the weather between the V6 and R2 growth stages and consult with your local extension personnel to decide if a fungicide might be warranted for corn to prevent tar spot, or other foliar diseases.

Figure 4. Signs of the Tar Spot Fungus on Corn Residue

Scouting and Watching Weather Reports Might Pay in 2019. Once corn and soybeans are planted, take the time to scout and pay attention to the weather. While thorough scouting can take time, it may be worth it in 2019. Catching a plant disease early can be the difference in being successful in managing it or not. Pay attention to the weather leading up to, and during, the critical crop growth stages. This can also help you make an educated decision about in-season application of fungicides. If it is cool and humid/rainy, and the crop is at a susceptible growth stage, then a fungicide application might be warranted. If it is hot and dry and the crop moves quickly through susceptible growth stages, then a fungicide might not be warranted. Study the disease triangle and use it to your advantage. The 2019 field season could be a year that this knowledge might be handy!

For in-season updates follow us on Twitter and Consult our websites at the links below:

Dr. Damon Smith

@badgercropdoc

https://badgercropdoc.com/


Dr. Darcy Telenko

@DTelenko

https://extension.purdue.edu/fieldcroppathology/


For More information about tar spot, white mold, and fungicide efficacy consult the following resources:

  1. Tar spot Fact sheet
  2. Short Tar Spot Video
  3. Tar Spot Webinar 
  4. White Mold Fact Sheet
  5. Short White Mold Video
  6. White Mold Webinar
  7. Corn Fungicide Efficacy Table
  8. Soybean Fungicide Efficacy Table

A New Video Launched – Tar Spot of Corn: A Wisconsin Perspective

Damon L. Smith, Ph.D., Associate Professor and Extension Specialist, Department of Plant Pathology, University of Wisconsin-Madison

Concerned about tar spot on corn in 2019? Haven’t been able to get to a winter meeting to learn how you might control it, in Wisconsin? We have a solution for you! A new video was just launched where Dr. Damon Smith presents a short lecture about tar spot on corn including symptoms, severity, and hybrid and fungicide trial results in Wisconsin in 2018. This lecture is meant to tie together our research progress in 2018 to guide management recommendations in 2019, in Wisconsin. For other information on tar spot in Wisconsin, you can consult our previous video or check out our previous posts on tar spot symptoms and pathogen signs on corn, and hybrid response to tar spot. You can also find information about fungicide efficacy in 2018 by downloading our 2018 Wisconsin Fungicide Test Summary.

The Effect of Tar Spot on Corn Hybrids in Wisconsin in 2018

Damon Smith, Department of Plant Pathology, University of Wisconsin-Madison

Brian Mueller, Department of Plant Pathology, University of Wisconsin-Madison

Joe Lauer, Department of Agronomy, University of Wisconsin-Madison

Kent Kohn, Department of Agronomy, University of Wisconsin-Madison

Thierno Diallo, Department of Agronomy, University of Wisconsin-Madison

Tar Spot signs and symptoms on a corn leaf

If you are like me, you are probably wishing 2018 would just go ahead and get it over with. It was a challenging year for farmers, practitioners, and extension personnel. This fall and winter has been consumed with questions and meetings trying to evaluate all of the disease issues of 2018, especially on corn. The topic of main concern has been tar spot and what the data are telling us in terms of managing this problem moving forward. I’m not going to re-hash what tar spot is and what causes it here. If you want to know more about the disease, you can read my previous post on the subject or watch my short video. I will say that the epidemic was significant and in some locations in Wisconsin, hit yields reasonably hard. I am getting a number of questions about hybrid resistance to tar spot. Is there any? What hybrids are resistant? Well, let’s take a look at a little data.

The Hybrid Performance Trials

The epicenter of the 2018 epidemic in Wisconsin was definitely in the Southwestern part of the state. Areas around Cuba City to Platteville were hit hard and early. As part of the Wisconsin Hybrid Performance Trials a test plot was evaluated for tar spot near Montfort, WI. Details of the implementation, data acquisition and other information pertaining to the Wisconsin Hybrid Performance Trials can be found by clicking here. In addition to the data that was described there, we evaluated tar spot severity and canopy greenness and related that information to grain yield. Those data are below.

Acquiring the Data

Disease ratings for this location were performed on two dates. For the early (98-106 day) relative maturity (RM) trial we rated tar spot severity on the ear leaves on 8/31/2018. For the late RM trial (104-113 day) we rated tar spot severity on 9/4/2018. In addition to taking tar spot data, we also determined the canopy greenness as the relative percentage of canopy still green on that rating date. Many have observed that as tar spot severity increased, corn plants tended to dry faster. The greenness score was meant to understand the level of senescence relative to the tar spot severity level. Yield was determined as described in the details of the hybrid performance trials. We then used standard mixed-model analysis of variance to determine differences in tar spot severity, canopy greening, and yield. We also looked at the relationship of tar spot severity to yield using linear regression. This latter analysis was meant to understand the yield reductions relative to the tar spot severity across hybrids at this location.

The Results

For both the early RM trial (Figure 1) and the late RM trial (Figure 2) there were significant differences in tar spot severity among hybrids tested.

Figure 1. Tar Spot Severity and canopy greenness for early RM hybrids at Montfort, WI in 2018.


Figure 2. Tar Spot Severity and canopy greenness for late RM hybrids at Montfort, WI in 2018.

Some hybrids do appear to be relatively resistant with severity ratings averaging 10-20%. However, other hybrids seems quite susceptible with severity ratings near 50%. No particular brand had hybrids that were more resistant than the other brand. Each hybrid varied in its level of resistance within brand. Also, note that no hybrid was completely devoid of disease. There appears to be no complete resistance to tar spot, but definitely some partial resistance in some hybrids.

Canopy greenness was generally negatively correlated with increasing tar spot severity. What was interesting is that as tar spot severity (area of the ear leaf covered by tar spot, spots) increased to 50%, canopy greenness often fell almost to 0%! Indeed, tar spot does seem to induce early senescence, especially in hybrids that aren’t as resistant.

Figures 3 and 4 show yield data from both the early RM (Figure 3) and late RM (Figure 4) trials for each of the same hybrids from the figures above. Hybrids are in the same order, and in both cases, there does seem to be some general yield reduction from low tar spot severity to high tar spot severity. But how much?

Figure 3. Yield from the early RM trial at Montfort, WI in 2018.


Figure 4. Yield from the late RM trial at Montfort, WI in 2018.

Our subsequent linear regression analysis (Figure 5) shows that there was clearly a trend toward lower yield as tar spot severity increased. For the early RM trial the fit of our line is better than for the late RM trial, however, the slope of the line indicates that there was a general reduction in yield as tar spot severity increased. For the early RM trial as tar spot severity increased by 10%, yield was reduced by about 7.8 bushels/acre, however, yield potential in this trial was almost 254 bushels/acre. In the late RM trial yield potential was 262 bushels/acre, but for every 10% increase in tar spot severity, yield was reduced by 13.5 bushels/acre.

Clearly there is some error in fitting our lines here and some “noise” in the data. This is most likely due to some differences in RM rating among companies and inherent genetic differences. However, there does seem to be a trend that as tar spot increases, grain yield in corn can be reduced. At this particular location, if we extrapolated our estimates out, at high ear leaf severity (45-50%), yield was reduced by 40-60 bushels/acre.

Figure 5. Yield relative to increasing tar spot severity for the early and late RM trials at Montfort, WI in 2018.

The Take Home

Some corn hybrids are more resistant than others to the tar spot pathogen. Resistance is not tied to a particular brand. That is to say, when it come to tar spot, every hybrid has to stand on its own. Strong resistance in corn hybrids in the trial above wasn’t common and immunity did not exist. As you make seed selections for 2019, push your seedsman to show you data from other trials for a particular hybrid where tar spot was a problem. Check other states data if you have to. For example, Dr. Martin Chilvers at Michigan State University conducted similar tar spot ratings on hybrids tested in Michigan. You can find the results of these hybrid evaluations by clicking here. Look for hybrids that gave a consistent response across multiple locations. Realize, even the best hybrid will still get some tar spot if the weather is favorable for the disease.

Fungicides might be warranted to further reduce tar spot once you have chosen a resistant hybrid. There are fungicides that do a decent job of reducing tar spot severity. The 2018 Wisconsin Field Crops Pathology Fungicide Tests Summary includes several trials where the efficacy of tar spot was evaluated. You can find those trials by clicking here. While there does seem to be some good choices in fungicide products, timing of application will be critical. It seems that fungicide applications that most closely coincided with the onset of the tar spot epidemics in a particular location, gave the best results. Thus, the performance of a fungicide will only be as good as the application timing relative to the start of the epidemic. To assist in making recommendations to spray, we are working on a tar spot prediction tool. Look for details of this tool next summer and be sure to follow Wisconsin Crop Manager News and Badercropdoc.com to get the latest updates and recommendations.

Badger Crop Doc with Ashley Davenport for an AgPro Podcast

Dr. Damon Smith, or @badgercropdoc, is an extension specialist and associate professor at the University of Wisconsin, Madison. We’re talking about different agronomic issues farmers have faced this year, including a newer one: tar spot. You can listen to the Podcast here.

2018 Corn Silage Fungicide Trial Results: A Story of Vomitoxin

Damon L. Smith, Ph.D., Associate Professor and Extension Specialist, Department of Plant Pathology, University of Wisconsin-Madison

Brian Mueller, M.S., Assistant Researcher, Department of Plant Pathology, University of Wisconsin-Madison

John Goeser, Ph.D., Adjunct Assistant Professor, Department of Dairy Science, University of Wisconsin-Madison and Animal Nutrition and R&I, Rock River Labs

Figure 1. Gibberella ear rot on corn.

The 2018 corn growing season can be summed up by saying it has been challenging. In Wisconsin, corn diseases have kept producers and agronomists moving to try to manage multiple issues for much of the summer. Early in the season gray leaf spot (GLS) moved in quick, followed by onset of a new disease called tar spot (TS), then northern corn leaf blight (NCLB) reared its head in August. This was then followed by high levels of ear rot in some fields. This is the first season that I have had to rate four diseases in one research trial. While GLS, NCLB, and TS create their own unique management challenges they can also stress the corn plant which results in secondary issues such as loss in stalk integrity or a plant that is left susceptible to other pathogens. I have written a previous article describing some of these issues, and how to deal with them.

To manage some of these foliar issues, increasing interest has been placed on using fungicides, especially in grain corn. Over the last several seasons, interest is growing from dairy producers who are also treating corn silage hybrids with fungicide. Why all the interest in treating silage corn with fungicides? Some of the intent is to improve feed digestibility. Dr. Felipe Cardoso’s animal science laboratory at the University of Illinois has published several peer-reviewed papers describing the physiological changes in the corn plant treated with fungicides, that result in improved feed digestibility. In those studies, yield was often not directly impacted by the fungicide application, but fibrous changes in the corn plant improved feed conversion to milk production in cows fed silage corn treated with fungicide (Haerr et al., J. Dairy Sci., 2015; Kalebich et al., J. Animal Feed Sci., 2017). Our laboratory at the University of Wisconsin-Madison is also interested in the effects that fungicides might have on mycotoxin accumulation in silage corn hybrids. We are especially interested in the accumulation of deoxynivalenol (DON or vomitoxin). In corn, DON is primarily produced by a fungus called Fusarium graminearumFusarium graminearum can cause Gibberella ear rot (Fig. 1) and also Gibberella stalk and crown rot of corn (Fig. 2).

Figure 2. Severe Gibberella stalk rot (left). Photo Courtesy of Craig Grau.

Mycotoxins are secondary metabolites produced by fungi, that can be toxic to plants and/or animals (including humans). These are termed secondary metabolites as they are not produced by primary metabolism in fungi. We understand some things about secondary metabolism in fungi, but there is much left to learn. Stressors on fungi can be responsible for inducing secondary metabolism, but other environmental and substrate cues might also be important. The inconsistency in induction of secondary metabolism in fungi, might be one reason that we see no linear relationship between ear rot in corn and vomitoxin accumulation. It is not uncommon to find low levels of ear rot, yet find high levels of vomitoxin in finished corn grain.

Animal nutritionists have observed many impacts of mycotoxins on animals, including dairy cattle. These can range from simple reductions in milk production all the way on up to feed refusal, hemorrhaging, and death. For this reason, nutritionists have devised guidelines for dietary limits of some mycotoxins to reduce harm to the animal. Dr. John Goeser has assembled the “Mycotoxin Guidelines and Dietary Limits” fact sheet to help producers better understand the potentially harmful toxin levels in the total diet (DM). You will see in that chart that for DON, the suggested limit is just 0.5 to 1.0 ppm for dairy cattle. The fact sheet also provides a helpful formula to understand the contribution of toxin in a particular component of feed, relative to the total diet.

So how do fungicides affect DON in corn plants at harvest? Let’s look at some data from Wisconsin in 2017 and 2018.

Results of 2017 Silage Corn Fungicide Trials

During the 2017 growing season, we conducted a small-plot research trial at the Arlington Agricultural Research Station located in Arlington, WI. The brown midrib (BMR) corn hybrid ‘P0956AMX’ was chosen for this study. Corn was planted on 11 May and chopped on 13 Sep. Single applications of various fungicide products (Fig. 3) were applied at growth stages V6 (19 Jun), R1 (26 Jul), 5 days post R1 (31 Jul), and 10 days post R1 (4 Aug). Ear rot severity was assessed by visually rating five ears per plot on the day of harvest. Yield was determined by harvesting the center two rows of each plot using a small plot silage chopper with an onboard platform weigh system. Chopped sub-samples were collected from each plot and analyzed for deoxynivalenol (DON) content.

Figure 3. Yield and Forage Quality, 2017


Consistent with other datasets, we found no significant difference in yield across treatments (Fig. 3). Unlike other studies, little difference in digestible fiber (TTNDFd) could be found among all treatments. This could be due to the fact that we started with a high-quality BMR hybrid, thus not readily responding to physiological changes that correspond to increased feed quality when treated with fungicide.

Figure 4. Ear rot and DON concentration at harvest, 2017

All fungicide treatments resulted in a significant reduction in DON content compared to the non-treated control, except Delaro applied at V6 and Quilt Xcel applied at R1 (Fig. 4). Application of the experimental 1 fungicide applied at R1 resulted in the lowest DON content among treatments. Remaining treatments had comparable DON levels to experimental 1 except for Quilt Xcel at R1. These results were consistent with previous data from Canada indicating that there is a narrow window of application-timing (especially when using Proline), when the goal is to reduce DON. The window of application begins at R1 (silking) and ends around 10 days after the start of R1.

Results of 2018 Silage Corn Fungicide Trials

In 2018, we repeated trials that we began in 2017. However, we made several modifications, including adding treatments and adjusting application timings. We also added another hybrid, in addition to repeating trials on PO956AMX. The new hybrid was another BMR, F2F627. We also made plots wider. We increased the width so that we could harvest our center two rows of plot using the small-plot chopper and also destructively sample plants on rows 2 and 5. We cut 5 plants from these rows in a subset of fungicide-treated, or non-treated plots. We then removed the ears (husks attached to ear) from the stalks. We ground the stalk portion and the ear portion and kept these samples separate, so that we had paired-samples for each of these plots. We wanted to know where DON was accumulating in the corn plant. Remember that F. graminearum can cause a stalk rot AND an ear rot. Plots were planted on May 1 in 2018. Growth stage V6 applications were made on June 15, V12 on July 11, R1 on July 18, and R2 on August 1. Plots were chopped on Sep 12. All data acquisition and sample testing was the same as in 2017, with the exception of adding the paired-samples for DON testing. Data from each hybrid were analyzed separately as these hybrids were planted in two separate blocks of the same field.

Figure 5. Disease, yield, and DON data for 2 silage corn hybrids treated with fungicides in 2018 in Arlington WI.

Figure 5 shows mean foliar disease, ear rot, yield, forage quality, and DON levels for both hybrids. Data are sorted by DON level and red highlights of certain products/timings are included to show which were consistent across both hybrids. Foliar disease and ear rot were higher in 2018 than 2017. Each hybrid responded a bit differently to each disease. Similar to 2018 there was little effect of fungicide on yield and forage quality. For PO956AMX, fungicide application also did not significantly affect DON levels. For F2F627 there were some marginally significant differences in DON as a result of fungicide application. Regardless, DON levels were extremely high in this field. This was a natural epidemic, indicating that the environment was very conducive for the fungus in 2018. Some products were consistent across trial in giving some reduction relative to the non-treated. These included Proline applied at R1, Delaro applied at R2, and Miravis Neo applied at V6. With that said, levels of DON were still over 7 ppm, even in better performing treatments. In years where the environment is conducive for F. graminearum, fungicide alone won’t be enough to reduce DON levels to acceptable limits. Incorporation of other techniques such as resistant hybrids will be needed.

What Part of the Plant is DON Accumulating?

Figure 6. Analysis of variance (ANOVA) table and DON levels in stalks and ears of corn plants sampled from two corn hybrids.

Results of our paired-sample analysis were interesting. We chose to sample plots from the non-treated and two fungicide treatments. The details of which fungicide treatments are not important here, as treatment had little effect on DON level in this analysis (Fig. 6). The part of the plant we sampled was significant, as was the interaction of hybrid and plant part. Interestingly, we were able to find high levels of DON in stalks and ears, with PO956AMX actually having twice the level of DON in stalks compared to ears. F2F627 responded differently with higher DON in ears than stalks.

We also dug a little deeper into this relationship, and conducted some correlation analysis with several parameters from these plots. Bissonette et al. (2018) reported that in wheat, DON levels in grain were positively correlated with straw DON levels. They hypothesized that this correlation was due to the fact that DON is water soluble and can be washed from the grain to the straw, in the field, during rain events. We wanted to see if stalk DON was correlated with ear DON in our corn trials, as a similar phenomenon might exist in corn.

Figure 7. Spearman correlation coefficients for several parameters measured in corn plots (2 hybrids) treated with fungicide or not treated in 2018.

Figure 7 shows that while ear DON levels are correlated (either positively or negatively) with some other parameters, ear DON was not significantly (alpha=0.05) correlated with stalk DON. In fact, the relationship (while not significant at alpha=0.05) was actually negatively correlated. This suggested that stalk DON levels and ear DON levels might be originating from independent events in these corn trials. Remember that F. graminearum can cause a stalk and crown rot  AND/OR an ear rot. These different diseases can occur independent of each other. Thus, it is plausible that the stalk DON levels might be due to stalk infection and subsequent rot, that isn’t necessarily related to ear rot in corn.

Summary

What does all of this data mean? Well, first it means the Badger Crop Docs have some more work ahead of them. However, we have some interesting data that suggests the following:

1. DON can accumulate in ears AND stalks

-Farmers should test stalks for DON level if planning to feed

2. Some hybrids might be more susceptible to stalk DON accumulation than ear DON accumulation (PO956AMX vs. F2F627)
3. DON accumulation in stalks might be independent from ear DON accumulation

-Think crown and stalk infection vs. ear infection by F. graminearum

-Different than wheat, where water-leaching of DON may be leading to straw DON

4. Fungicide may not always reduce DON, especially in years conducive for F. graminearum or when stalk infection is a primary means of DON accumulation in the corn plant

-It might be hard to get fungicide into stalks to reduce stalk infection; Thus, DON still accumulates in the stalk portion, independent of ear infection control by fungicide applied at R1

5. Best all around fungicide timing when trying to reduce DON still likely R1 (this is dependent on product); this timing has the best chance of reducing DON in the ear, where DON can be high in some hybrids

-Could V6 application timings be reducing stalk infection and subsequent stalk DON accumulation? More work needs to be done.

References

A Farmer’s Guide to Corn Diseases. 2016. Wise, K., Mueller, D., Sisson, A., Smith, D., Bradley, C., and Robertson, A., eds. APS Press, St. Paul, MN. 161 pp.

Bissonnette, K.m., Kolb, F.L., Ames, K.A., and Bradley, C.A. 2018. Effect of Fusarium head blight management practices on mycotoxin contamination of wheat. Plant Disease 102:1141-1147.

Compendium of Corn Diseases, 4thEdition. Munkvold, G. and White, D., eds. APS Press, St. Paul, MN. 165 pp.

Haerr, K.J., Lopes, N.M., Pereira, M.N., Fellows, G.M., and Cardoso, F.C. 2015. Corn silage from corn treated with foliar fungicide and performance of holstein cows. Journal of Diary Science 98:8962-8972.

Kalebich, C.C., Weatherly, M.E., Robinson, K.N., Fellows, G.M., Murphy, M.R., and Cardoso, F.C. 2017. Foliar fungicide (pyraclostrobin) application effects on plant composition of a silage variety corn. Animal Feed Science and Technology 225:38-53.

Mycotoxins: Risk in Plant, Animal, and Human Systems. 2003. Richard, J.L., Payne, G.A., Desjardins, A.E., Maragos, C., Norred, III, W. et al., eds. Council for Agricultural Science and Technology, Ames, IA. 199 pp.