
Wisconsin White Mold Risk Maps – July 8, 2018
Damon L. Smith, Extension Field Crops Pathologist, University of Wisconsin-Madison
**These maps are for guidance only and should be used with other sources of information and professional advice when determining risk of white mold development. For field-specific predictions, we encourage you to use the Sporecaster smartphone application. These predictions will be most accurate for your specific location. Information about Sporecaster and how to download can be found by clicking here. Sporecaster takes into account crop phenology, in addition to weather parameters, to make field-specific recommendations. The maps below are based on weather only and you must determine if your crop is currently phenologically at risk for infection. For more information on white mold and how to manage it, see my previous post.**
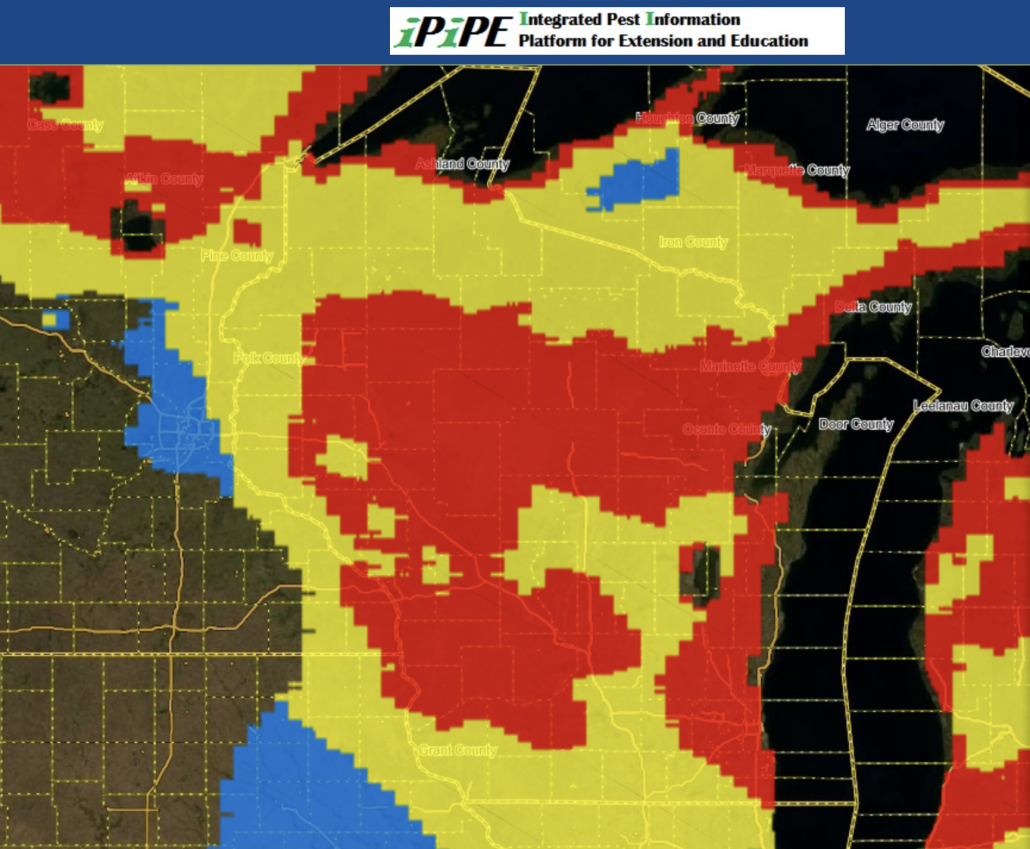
Map Legends: No color = model is inactive and risk of apothecia in the field is not likely; Gray = apothecia might be present, but likelihood of apothecial presence is extremely low; Blue = low risk of apothecia; Yellow = medium risk of apothecia in the field; Red = high risk of apothecia in the field. Model predictions must be combined with soybean growth stage and canopy characteristics to aid in timing of fungicide sprays.
Figure 1. White Mold Risk Map for Non-irrigated Fields – July 8, 2018
Continued dry and windy weather is beginning to reduce the predicted risk of white mold across Wisconsin in non-irrigated (dryland or rain-fed) soybean fields (Figure 1). While risk is high in some locations of the state, there is much more yellow and blue on the map compared to last week, indicating medium to low risk. Over the next week, I expect risk to continue to dissipate as weather is predicted to remain warm and dry. Areas of high risk are present along Lake Michigan and in the central and southwest portions of Wisconsin. In these areas, a fungicide application should be considered if the soybean canopy is nearly closed and flowers are present.
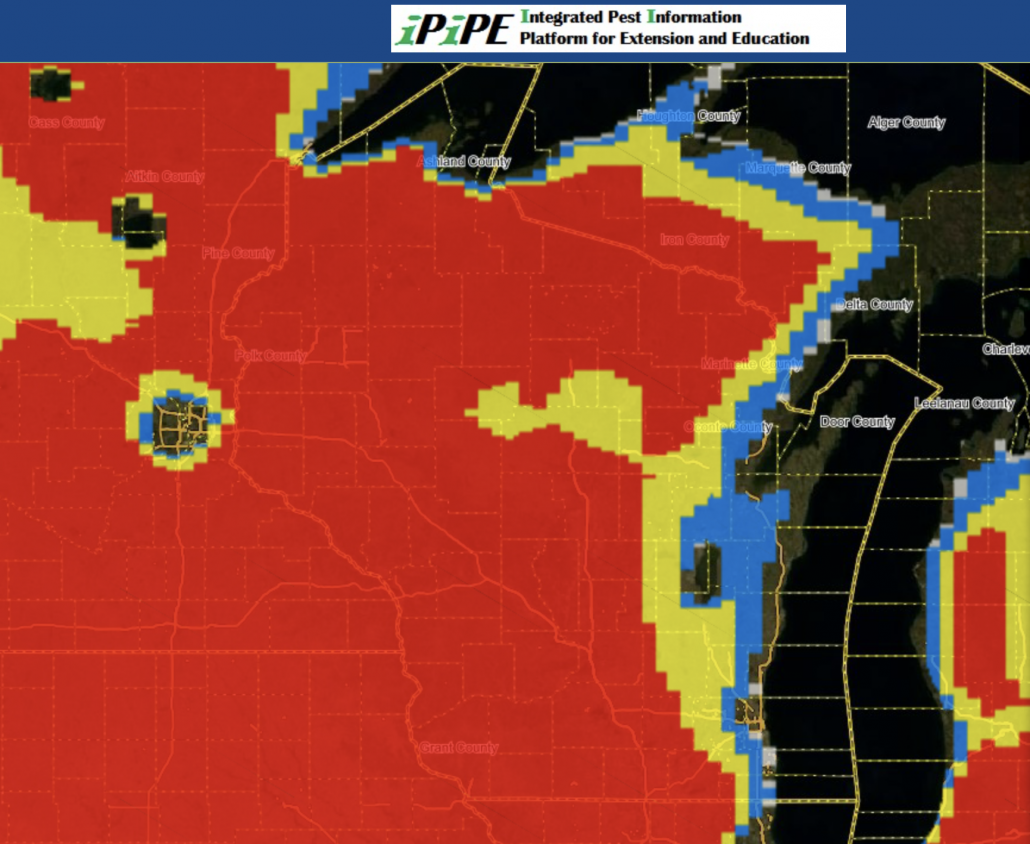
Figure 2. White Mold Risk Map for irrigated fields planted on 15″ row-spacing – July 8, 2018
As you might expect, risk is much higher across the state for irrigated soybeans planted to 15″ rows (Figure 2). Remember that there are different models for irrigated and non-irrigated soybeans. Thus predictions can vary across the state in these environments. A fungicide application should be considered if irrigating and soybeans are flowering and planted to a 15″ row-spacing. Note that if you have irrigation in your field but are not actually irrigating, you should be using the non-irrigated model above to make an accurate prediction of white mold risk.
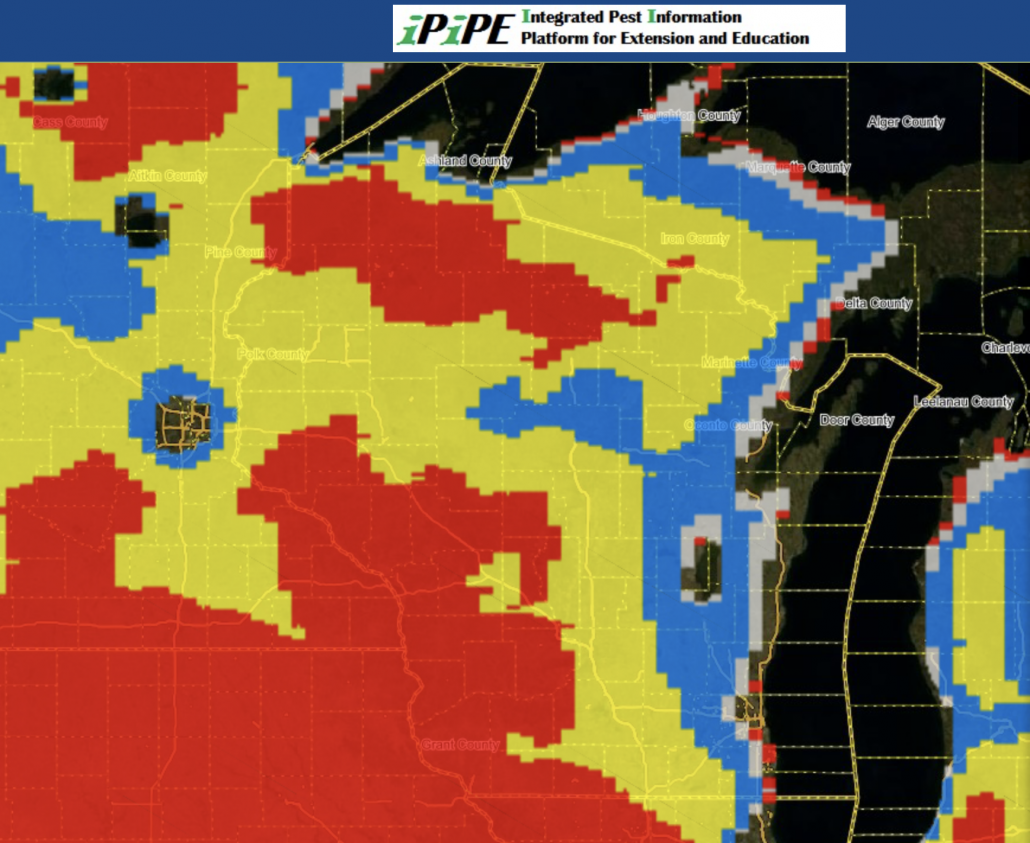
Figure 3. White Mold Risk Map for irrigated fields planted on 30″ row-spacing – July 8, 2018
Risk of white mold in irrigated fields planted to 30″ row-spacing is much a bit less than in 15″ spacing (Figure 3). However, areas of high risk are present in the southwest and far northern areas of soybean production. In these areas, a fungicide application should be considered if soybeans are being irrigated, canopy is nearly closed, and flowers are present.
These models were developed at the University of Wisconsin-Madison in conjunction with Michigan State University and Iowa State University to identify at-risk regions which have been experiencing weather favorable for the development of white mold fungus apothecia. Weather information and maps are provided by the Soybean Integrated Pest Information Platform for Extension and Education (iPIPE), which is managed by ZedX, Inc. This model predicts when apothecia will be present in the field using combinations of 30-day averages of maximum temperature, relative humidity, and maximum wind speed. Using virtually available weather data, predictions can be made in most soybean growing regions. Based on these predictions, a map is generated under three scenarios (non-irrigated soybeans, soybeans planted on 15″ row-spacing and irrigated, or soybeans planted on 30″ row-spacing and irrigated). The maps are colored to show the likelihood of apothecial presence within a region. If the model is predicting high risk (red) in your area for your planting scenario, the soybeans are flowering, and the canopy is somewhat closed, then the white mold risk is high. If your fields are at-risk, we recommend to consult your local extension personnel or other research-based resources for the best in-season management options for your area


Leave a Reply
Want to join the discussion?Feel free to contribute!